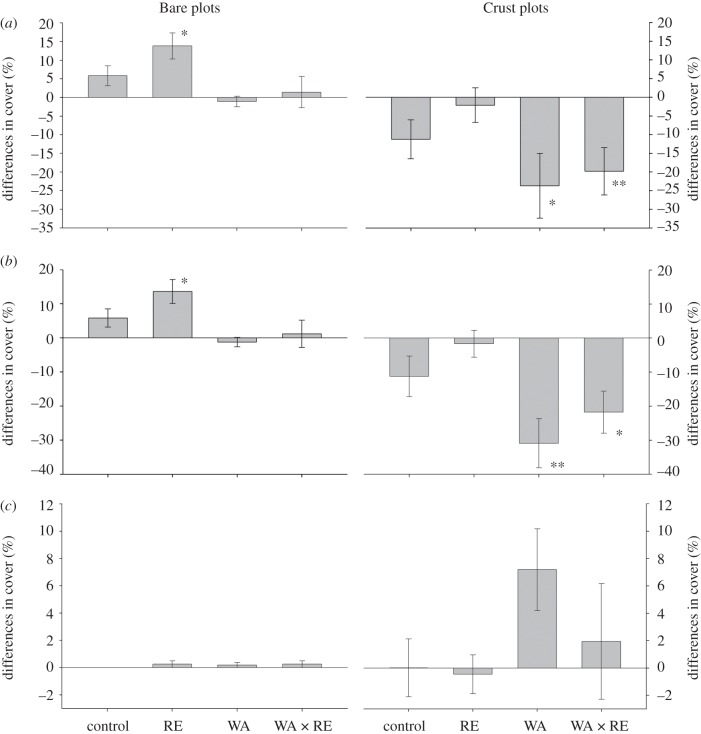
Figure 1.
Differences in the total cover of the whole BSC community (including lichens and mosses) (a), lichens (b) and bryophytes (c) in areas without (Bare plots) and with well-developed biological soil crusts (Crust plots) between June 2008 and May 2011. Data represent means ± s.e. (n = 9–10). RE, rainfall exclusion; WA, warming; and WA × RE, warming and rainfall exclusion. Asterisks indicate p-values from the Wilcoxon test: *p < 0.05, **p < 0.01, ***p < 0.001. See the electronic supplementary material, appendices S13–15 for raw data.

