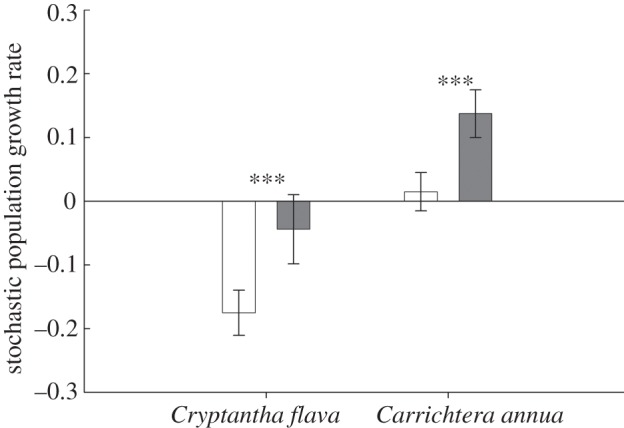
Figure 4.

Stochastic population growth rates (a = log(λS) ± 95% CI; number of jack-knife iterations = 999) under current and projected changes in frequency of wet, normal and dry annual periods (table 1) in the studied populations of the perennial C. flava and the annual C. annua. Three asterisks (***) represents significant differences at p < 0.001. Filled bars denote projected, unfilled bars, current.
