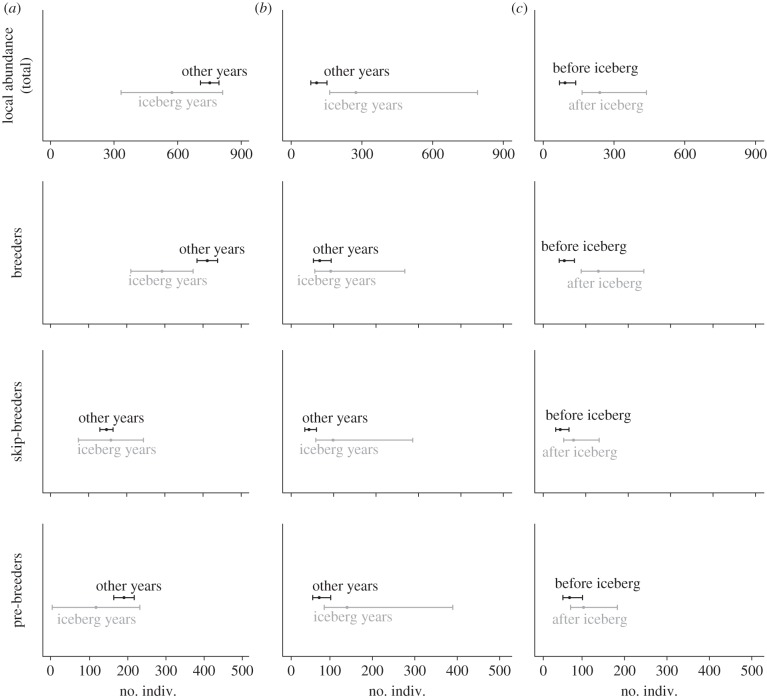
Figure 1.
Summary of the results obtained for the mean and process s.d. of the different components (breeding classes) of local abundance. (a) Comparison of the mean between iceberg years and during other years; (b) comparison of process s.d. between iceberg and non-iceberg years; and (c) comparison of process s.d. after and before the iceberg event. Error bars represent 95% CIs (i.e. error due to sampling variation). Note that for optimal scaling of CIs, x-axis ranges are not necessarily the same among individual graphs.

