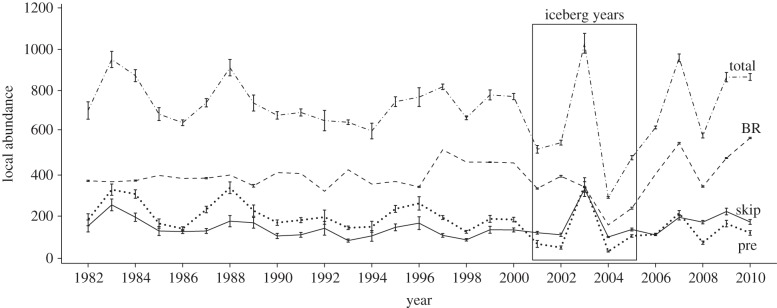
Figure 2.
Temporal variation in the size of the different breeding classes occupying colonies from 1982 to 2010. The dashed-dotted line represents the total local abundance (total), the dashed line represents the number of breeders (BR), the solid line represents the number of skip-breeders (skip) and the dotted line represents the number of pre-breeders (pre). The period during which the iceberg was present in the vicinity of seal colonies is showed by a solid frame. Error bars represent 95% CIs (i.e. error due to sampling variation).

