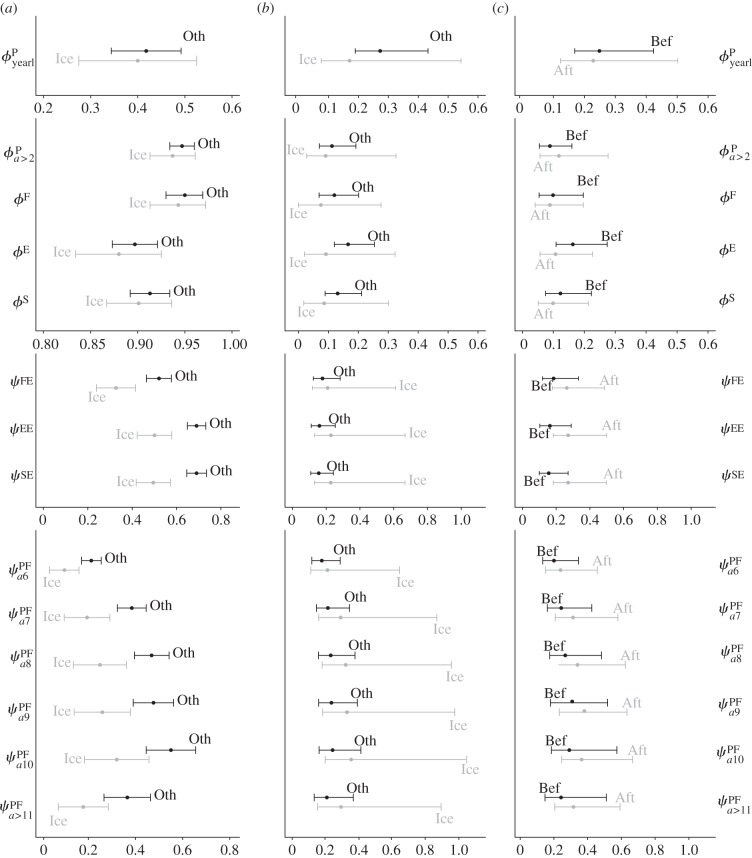
Figure 3.
Summary of the results obtained for the mean and process s.d. of vital rates. (a) Comparison of the mean between iceberg years (Ice) and during other years (Oth); (b) comparison of process s.d. between iceberg and non-iceberg years; and (c) comparison of process s.d. after (Aft) and before (Bef) the iceberg event. Error bars represent 95% CIs (i.e. error due to sampling variation). Note that for optimal scaling of CIs, x-axis ranges are not necessarily the same among individual graphs. Demographic parameters are represented by lowercase Greek letters: ‘ϕ’ (survival) and ‘ψ’ (reproductive rates, i.e. transition among breeding states). Superscripts represent states specificities of these parameters: ‘P’ (pre-breeder), ‘F’ (first-time breeder), ‘E’ (experienced breeder) and ‘S’ (skip-breeder). For transition parameters ψ, the first superscript represents state of departure (at time t) and the second superscript represents state of arrival (at t + 1). Subscripts represent age-specificity for the pre-breeder state: ‘yearl’ (yearling), ‘a ≥ 2’ (older than two), ‘a5’, ‘a6’, ‘a7’, ‘a8’, ‘a9’ and ‘a10’ (age 5, 6, 7, 8, 9 and 10, respectively), and ‘a ≥ 11’ (older than eleven). Note that yearling survival corresponds to survival from 1-year-old to 2-year-old.

