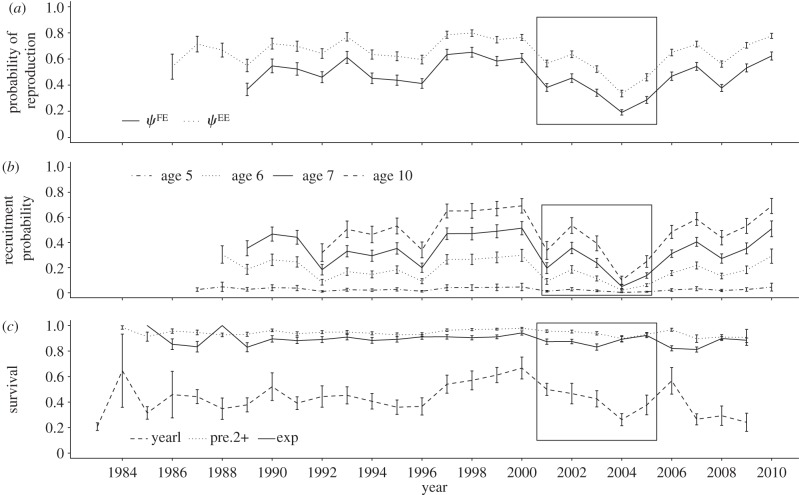
Figure 4.
Temporal variation of probabilities of (a) reproduction (ψFE, ψEE), (b) recruitment (ψPF) and (c) survival. The iceberg period is represented by a solid frame. Error bars represent s.e. (i.e. error due to sampling variation). Not all states and age classes are displayed on these graphs for better readability. ‘yearl’, yearling, which corresponds to second-year survival (i.e. survival from age 1 to age 2); ‘pre2+’, pre-breeders of age ≥ 2; ‘exp’, experienced breeders.

