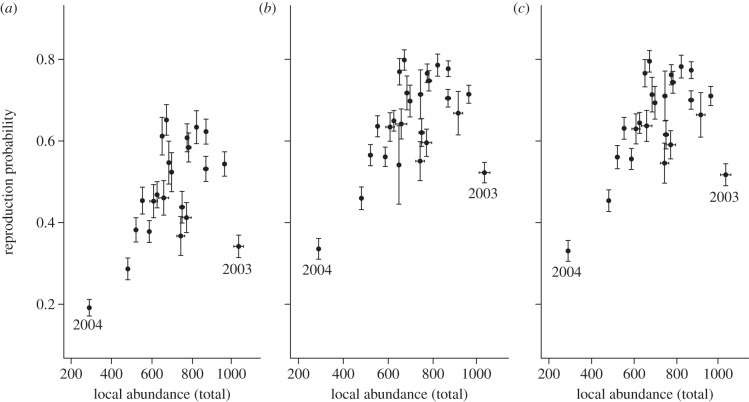
Figure 5.
Relationship between local abundance (x-axis) and the three state-specific reproductive rates (y-axis): (a) first-time breeders (ψFE), (b) experienced-breeders (ψEE) and (c) skip-breeders (ψSE). Years 2003 and 2004 are marked on each graph. Error bars represent s.e. (i.e. error due to sampling variation).

