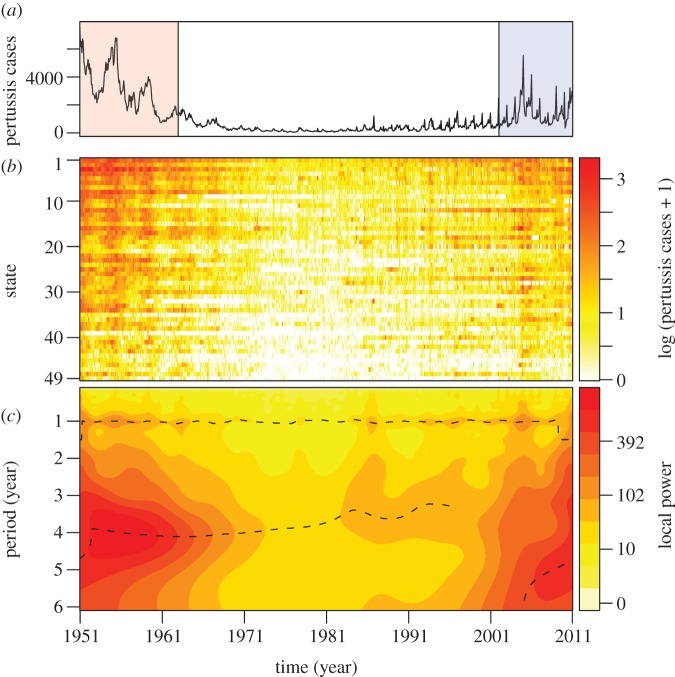
Figure 1.
Monthly notifications of pertussis cases in the 49 contiguous states of the US from 1951 to 2010, obtained from the National Notifiable Diseases Surveillance System. (a) Sum of monthly incidences in the 49 states. In the article, we particularly focus on the data from 1951 to 1962 (red shaded region) and from 2002 to 2010 (blue shaded region). (b) Log10-transformed monthly notifications for each state ordered according to mean population size and colour-coded according to incidence (colour scale on the right). States are: CA (row 1), NY (2), TX (3), PA (4), IL (5), OH (6), FL (7), MI (8), NJ (9), NC (10), GA (11), MA (12), VA (13), IN (14), MO (15), WI (16), TN (17), MD (18), WA (19), MN (20), LA (21), AL (22), KY (23), SC (24), CT (25), AZ (26), OK (27), CO (28), IA (29), OR (30), MS (31), KS (32), AR (33), WV (34), NE (35), UT (36), NM (37), ME (38), NV (39), RI (40), ID (41), NH (42), MT (43), SD (44), DC (45), ND (46), DE (47), VT (48), WY (49). (c) Average of the local wavelet power spectra of the 49 states, after incidence in each state was normalized. The dashed lines show the local maxima. For clarity of illustration, the spectral power is raised to 0.3 (scale on the right).

