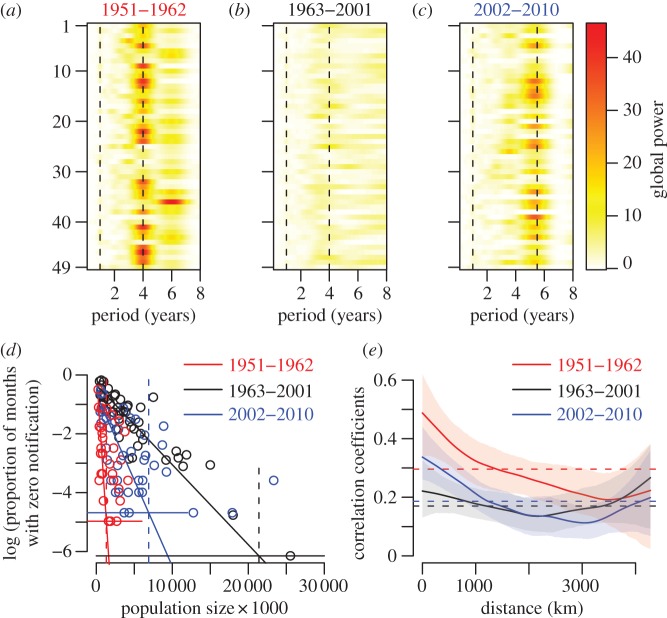
Figure 2.
Periodicity, CCS and spatial correlation for the three time periods considered (1951–1962, 1963–2001, 2002–2010). (a–c) Global wavelet power spectra for each state and colour-coded according to the scales on the left for (a) 1951–1962, (b) 1963–2001 and (c) 2002–2010. The vertical dashed lines show the 1-, 4- and 5.5-year periods. The states are ranked alphabetically. (d) Estimates of the CCS for the three periods: 1.3 million for early era (red vertical dashed line) with 34 states above it; 21.4 million for the middle era (black vertical dashed line) with 48 states below it; and 6.9 million for the recent era (blue vertical dashed line) with 12 states above it. Horizontal lines correspond to one month with zero notification over the considered time period. The intersections of these thresholds with the regression lines define the CCS. (e) Spatial synchrony with 95% CIs, same colour code as for (d). The horizontal lines are the mean correlation coefficients. (d,e) Red solid line, 1951–1962; black solid line, 1963–2001; blue solid line, 2002–2010.

