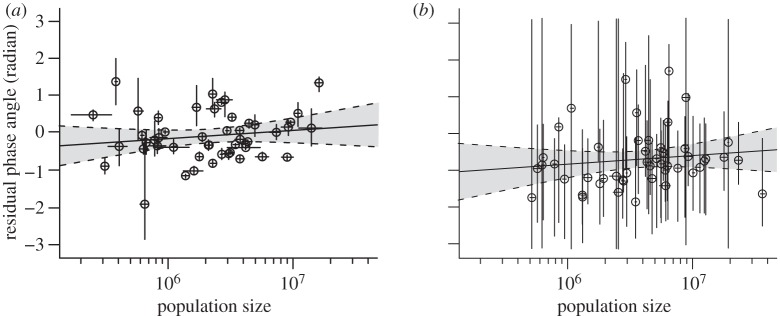
Figure 4.
Relationships between residual phase angles and decimal logarithm of population sizes for the early (a, 1951–1962) and recent (b, 2002–2010) eras. Horizontal and vertical bars show, for each state, the extent (over the considered time periods) of population size and residual phase angles, respectively. Open circles show the means, for each state, of the population sizes and residual phase angles. Full lines and grey areas show linear regressions and their 95% CIs. The slopes of these regressions are not significantly different from zero: F1,47 = 1.14, p = 0.29 for the first era and F1,47 = 0.85, p = 0.36 for the second era.

