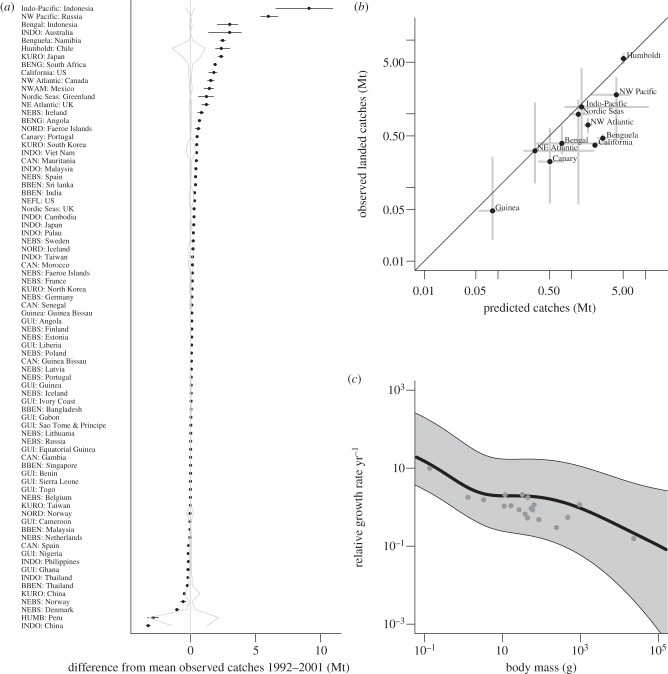
Figure 2.
Comparison of model results with data. (a) Differences from mean observed values of fisheries landings averaged over the 1992–2001 from 11 large regional domains, grouped by 78 country EEZ. Grey lines indicate range of interannual variation in the observed fisheries landings over 1992–2001 data, whereas error bars show the range of interannual values predicted by the model. (b) Relationship between modelled catches (Mt per year) and the observed landed catches aggregated to the domain level. The points show the median across all EEZ within each domain and the grey lines show the extent from the 25th to the 75th percentiles. Solid line is 1 : 1 relationship. (c) Mean modelled relative growth rates over 1992–2001 across all EEZ (grey areas, mean for northeast Atlantic shown in central line) along with relative growth rates at 10% of asymptotic size estimated from empirical von Bertalanffy growth equations for a subset of the fish populations from the northeast Atlantic given in Pauly [45].

