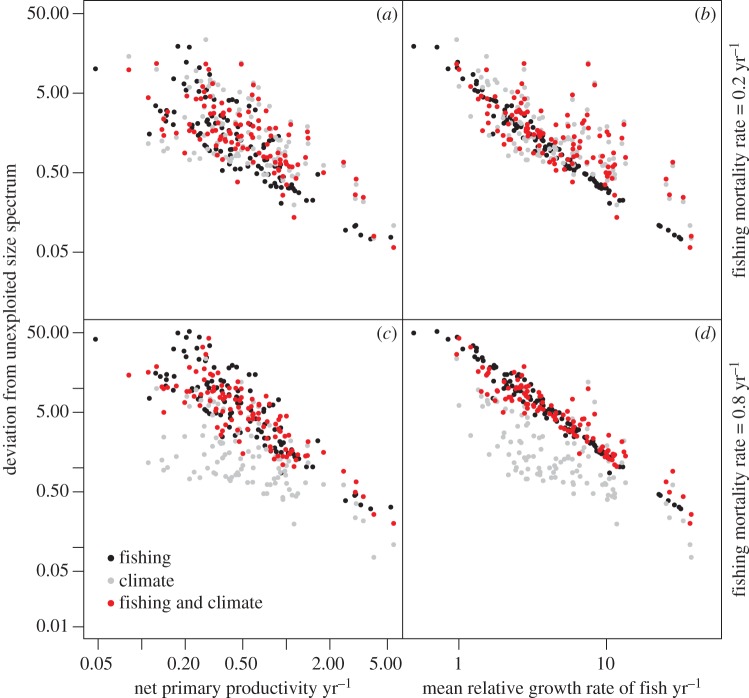
Figure 3.
Across-ecosystem effects of fishing and climate change. Deviation from the unexploited size spectrum versus mean net primary productivity (a,c) and mean relative growth rates of fish (b,d) when ecosystems are subjected to: fishing (black), climate change (grey) and climate and fishing (red). Each point represents an EEZ. Equilibrium results based on time-averaged environmental conditions under each scenario were used. Results shown for (a,b) low (0.2 yr−1) and (c,d) high fishing mortality rates (0.8 yr−1). Note the logarithmic scale markings on all of the axes.

