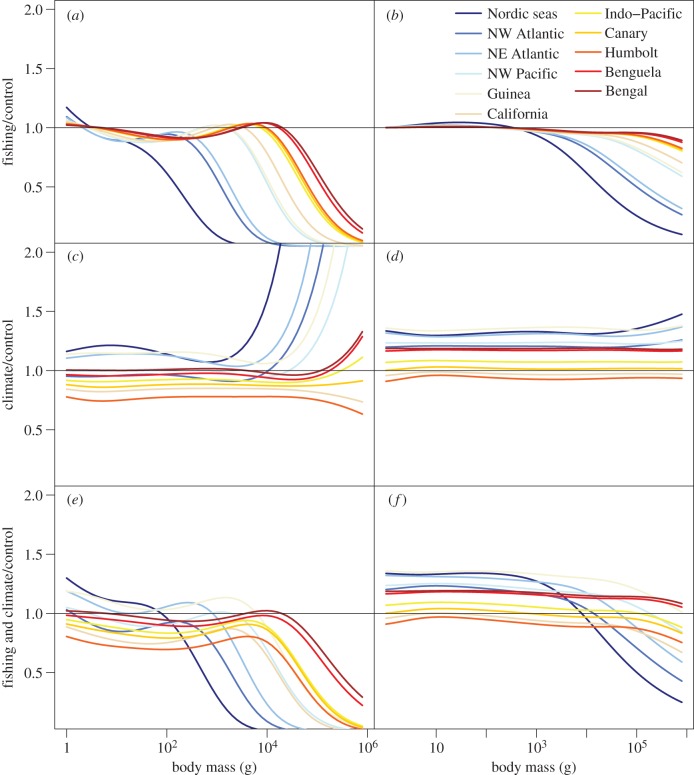
Figure 4.
Changes in community size structure from fishing and climate. Changes in density at size (a,c,e) and relative growth rates at size (b,d,f) relative to unexploited control size spectra for (a,b) fishing, (c,d) climate and fishing and (e,f) climate effects. Results shown are for heavy fishing mortality rates only (0.8 yr−1). Size spectra were averaged across each of the 11 large regional domains. The domains are ranked in the legend according to fish growth rates (from lowest in the Nordic seas to highest in Bay of Bengal).

