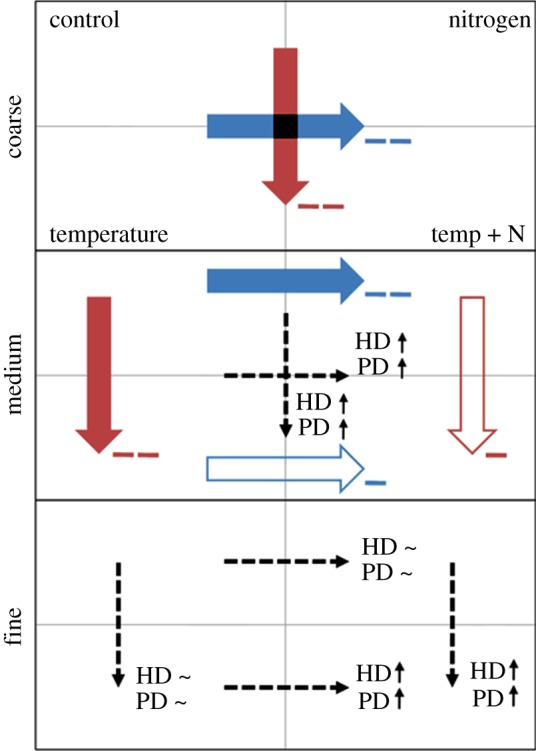
Figure 2.

Effect of temperature (red arrows) and nitrogen (blue arrows) treatments on interaction count at coarse, medium and fine resolutions. Subpanels represent treatment combinations (control, top left; nitrogen, top right; temperature, bottom left; and temperature and nitrogen, bottom right). Thick arrows reference within-grouping behaviour of posterior distribution sign in response to nitrogen and temperature; for example, at medium resolution the effect of the nitrogen treatment is more strongly negative (− −) on interaction count when temperatures are low compared with when temperatures are high (−). Dashed arrows reference between-grouping changes in host density (HD) and parasitoid density (PD) posterior distribution magnitude (up-arrows indicate increasing influence, tilde indicate non-significant influence); for example, at fine resolution when temperatures are low, the influence on interaction count attributable to host and parasitoid density does not change as nitrogen levels are increased; however, when temperatures are higher, the influence of host and parasitoid density are increasingly positive as nitrogen levels rise.
