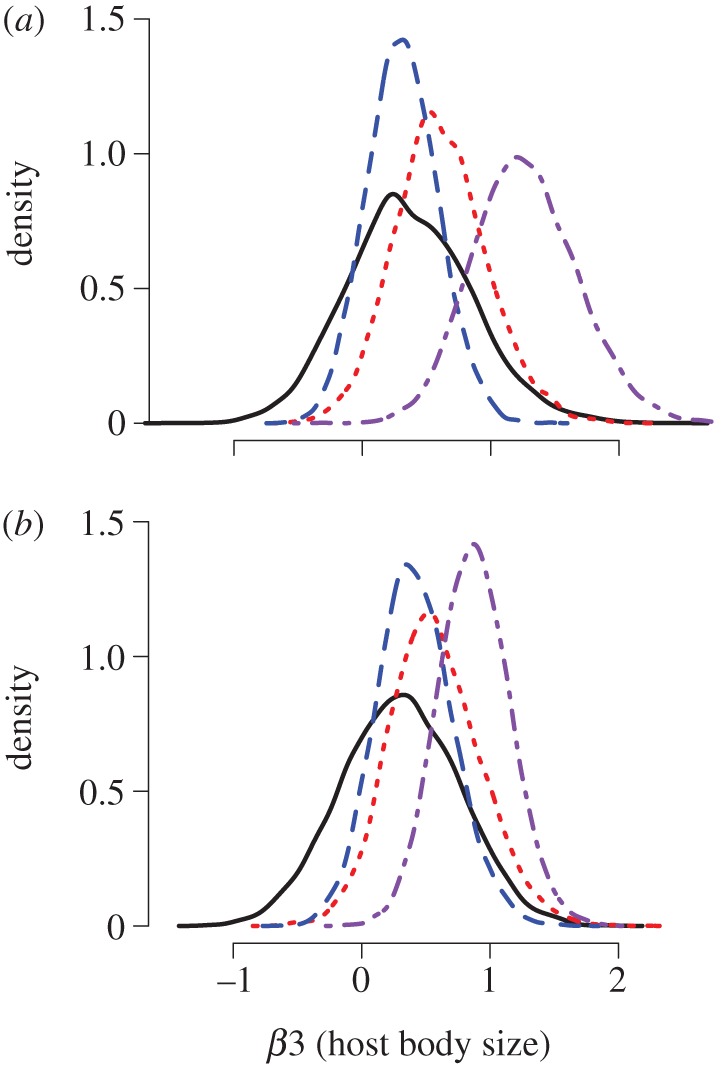
Figure 3.

Influence of host body size on interaction count at fine resolution. (a) Host body size uses average values across all treatments, and (b) host body size uses four treatment-specific sets of point estimates. Both figures show posterior distributions of the parameter associated with host body size under four treatments: control (solid line, black); control nitrogen and elevated temperature (dotted line, red); elevated nitrogen and control temperature (dashed line, blue); and elevated nitrogen and elevated temperature (dot-dashed line, purple). Host body size positively influences interaction count most strongly when nitrogen and temperature treatments are applied together. Note that the x-axis scale is parameter value, and does not represent a biological measurement.
