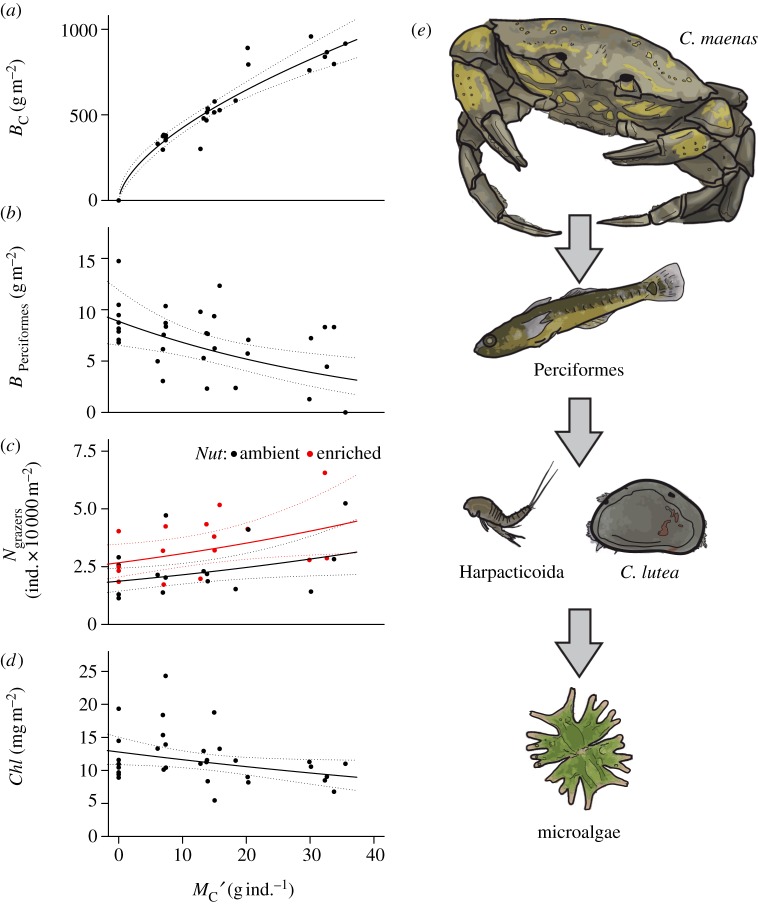
Figure 2.
Allometric trophic cascade. With an increase in average body mass of the top predator (Carcinus maenas), MC′, (a) its biomass, BC, increased following an allometric power law, BC = 2.02 MC′0.60. In consequence, (b) the group of Perciformes decreased in biomass; log10 (BPerciformes +1) = 0.994(±0.057 s.e.) − 0.01(±0.003) MC′, (c) the predominant mobile grazers, Cythere lutea and the crustacean order of Harpacticoida, increased in population density (and also as a consequence of nutrient addition); log10 Ngrazers = 4.269(±0.056) + 0.006(±0.003)MC′ + 0.155(±0.058)Nut, and (d) the chlorophyll concentration of microalgal biofilm on glass slides decreased; log10 Chl = 1.107(±0.035) − 0.004(±0.002)MC′. Response variables were corrected for the random effect of experimental block. Lines show back-transformed, log-linear models with 95% confidence bands. (e) Hypothesized trophic cascade.

