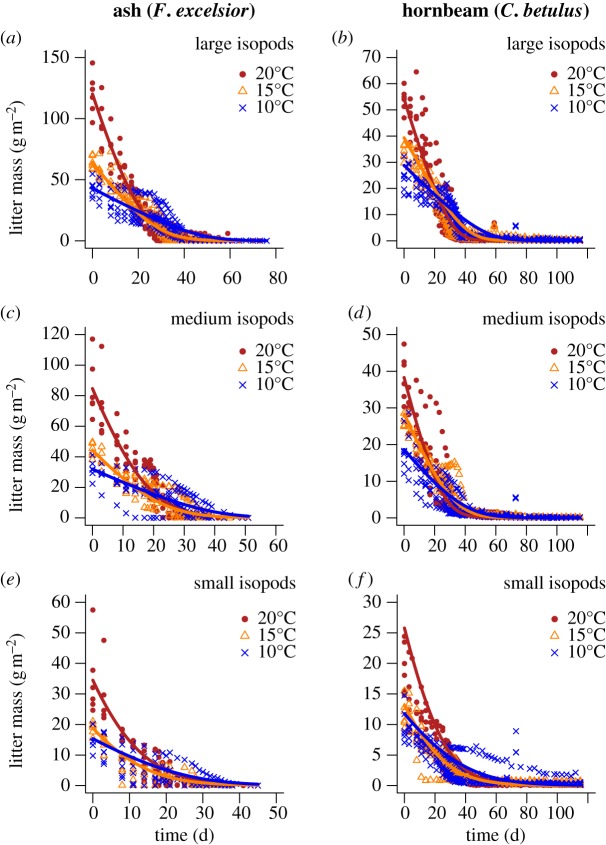
Figure 1.
Time-series of litter mass loss resulting from isopod consumption. Curves are based on the best-fitting functional-response model of isopods feeding on ash (a,c,e) and hornbeam (b,d,f) plotted as litter mass loss (g m−²) against time (day). We plotted panels with differently sized isopods: large (70–130 mg, (a,b)), medium (40–70 mg, (c,d)) and small (11–40 mg, (e,f)) to disentangle the size range of the isopods. (a–e) The overall trends for the three temperatures (blue line: 10°C, orange line: 15°C, red line: 20°C) are fitted to the six associated replicates. Note that we fitted a single model to the data while disentangling the data in this figure for clarity of presentation. See table 1 for model parameters.

