Figure 3.
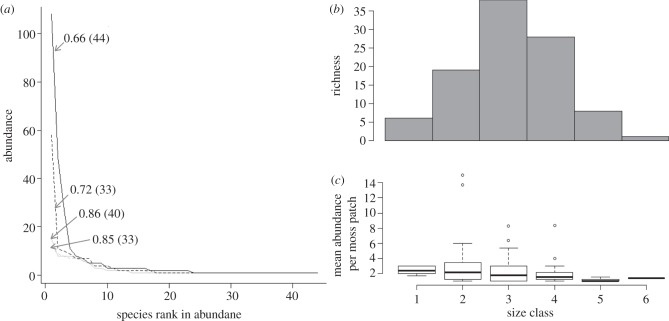
(a) Effect of warming on species abundance distributions. Rank-abundance curves from two experimental moss patches are shown. Patches were chosen to illustrate the differences in the shape of the rank-abundance distribution with warming. Warmed patches are shown in black, patches left at ambient temperature are shown grey. All patches were subjected to the same fragmentation treatment (d3). Evenness values for each community are indicated with the arrow, species richness is shown in parenthesis. The species with an abundance of 108 individuals (Isotoma sp., heated patch) corresponds to size class 4 in panels b and c. (b,c) Size-structure in the moss microarthropod community. Size of the microarthropods (from field samples) was measured using body length. The range of sizes was separated into six classes, after log10 transformation. Each class spans 0.2 units. Class 1 starts at 2.2. Panel (b) shows species richness per size class (plots indicate means with boxes showing inter-quartile ranges and whiskers indicating 95% confidence intervals); panel (c) shows mean abundance of the species (per moss patch) in the size classes.

