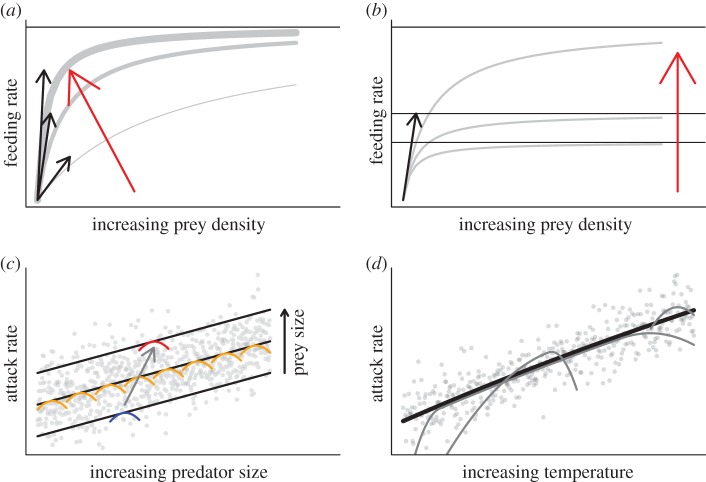
Figure 1.
Conceptual visualization of theoretical aspects. (a) Attack rates determine the initial increase in feeding rate at low resource abundance (aN, black arrows). At low resource densities, increasing attack rates (all else equal) correspond to higher feeding rates (red arrow). (b) Decreasing handling times lead to an increase in overall feeding rate (red arrow, horizontal lines correspond to maximum feeding rates Fmax ∼ 1/h). Feeding rates additionally depend on consumer and resource body size (c) and temperature (d). On a global interspecific scale, the rates (here exemplified using the attack rate) increase linearly with consumer mass in a log–log space (c). Within particular taxonomic groups, hump-shaped relationships are expected (orange, blue and red humps). Assuming a constant resource mass and an increasing consumer mass leads to different optimal body-mass ratios forming a plethora of small humps along the line of the global model (orange humps). Assuming a constant body-mass ratio and an increasing resource mass leads to different optimal predator masses (grey arrow from the blue to the red hump). Similarly, species have different thermal windows (d). To detect these multiple overlaying humps, we adopted a nested statistical design that first investigates the global relationships and, in a second step, the humps as residual deviations from the global model.

