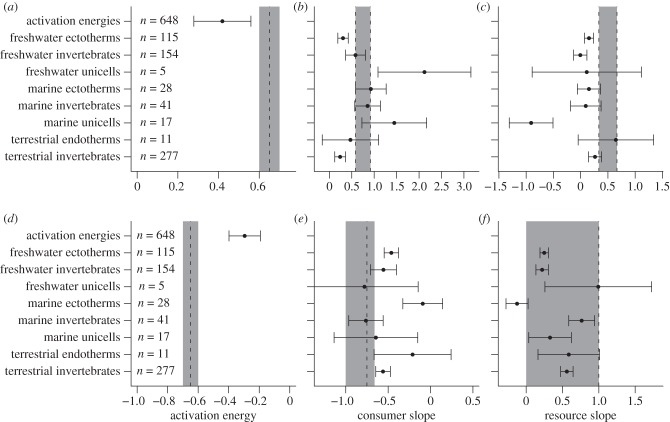
Figure 3.
(a–c) The estimated activation energies and allometric exponents for attack rates and (d–f) handling times. The points denote the estimate whereas the whiskers denote the 95% confidence values. The dashed vertical lines represent the different model expectations based on the Metabolic Theory of Ecology [38] and the foraging theory of McGill & Mittelbach [47]. Systematic mixing of these predictions is indicated by grey areas.

