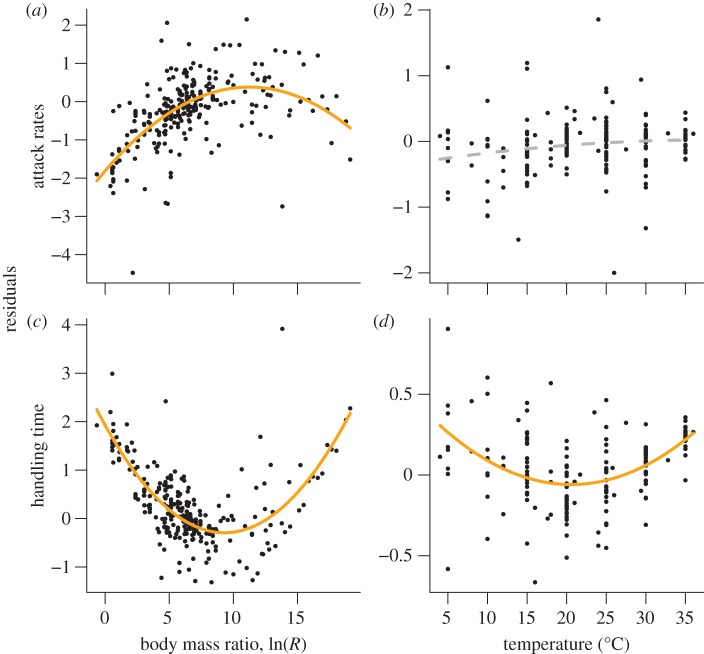
Figure 4.
Residual analyses of attack rates and handling times to identify nonlinear deviations (see figure 1c,d for a conceptional explanation). The exponent of the normalized residuals (residuals corrected for random effects of the consumer–resource pairs) is plotted as the dependent variable. (a) The attack rates exhibit hump-shaped relationships with consumer–resource body-mass ratios (residuals = −1.81** + 0.37** log(R) − 0.017* (logn(R))²), (b) whereas attack rates do not deviate significantly from the global temperature model (residuals = −0.34n.s + 0.02n.s. TC − 0.0003n.s TC²). The handling times follow a positive quadratic relationship with (c) body-mass ratios (residuals = 1.93*** − 0.48*** log(R) + 0.026*** (log(R))²) and (d) temperature (residuals = 0.51* − 0.055** TC + 0.0013*** TC²). The significance levels are ***p < 0.001, **p < 0.01, *p < 0.05, n.s. ≥ 0.05.

