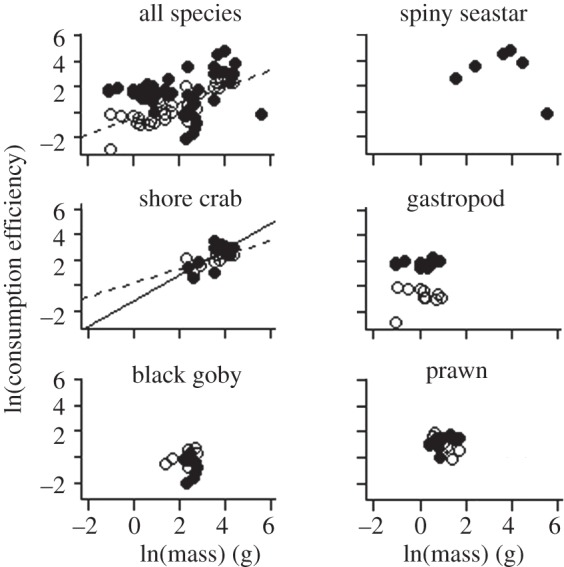
Figure 3.

Consumption efficiency–body mass (g, wet mass) regressions for each species at 16.5°C (solid circles and solid lines) and 18.5°C (open circles and dashed lines). The seastars did not consume any prey at 18.5°C and are therefore not included in this figure. See table 2 for intercept and slope values.
