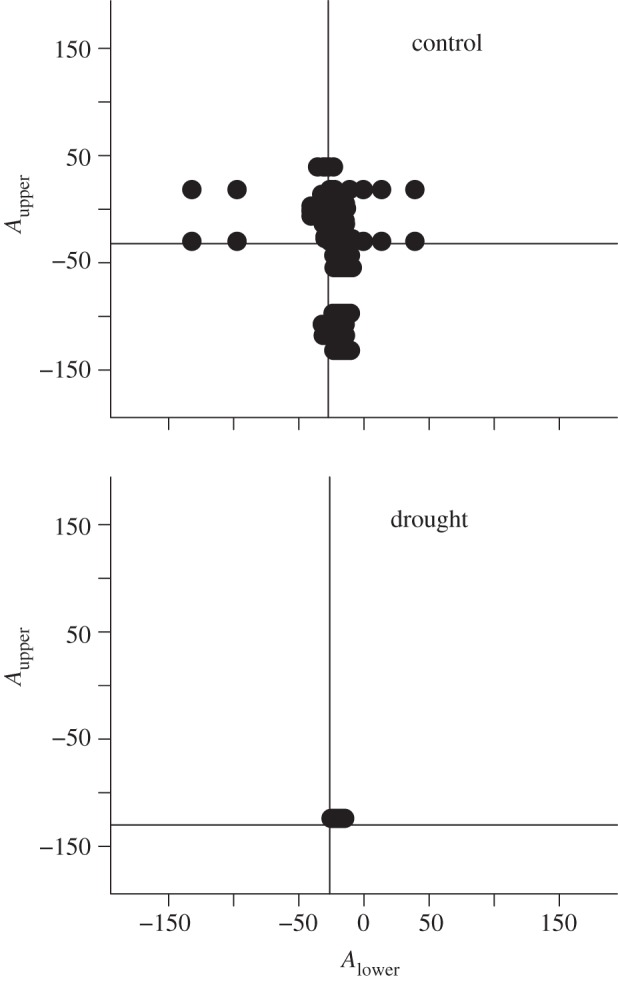
Figure 3.

Upper angle (Aupper) versus lower angle (Alower) of all 2-chains within food webs from the control and drought treatments. Vertical and horizontal solid lines represent median lower and upper angles for all 2-chains (see §2). One representative web (c4, d4) per treatment is shown here; all eight (c1–c4, d1–d4) are shown in the electronic supplementary material, figure S3.
