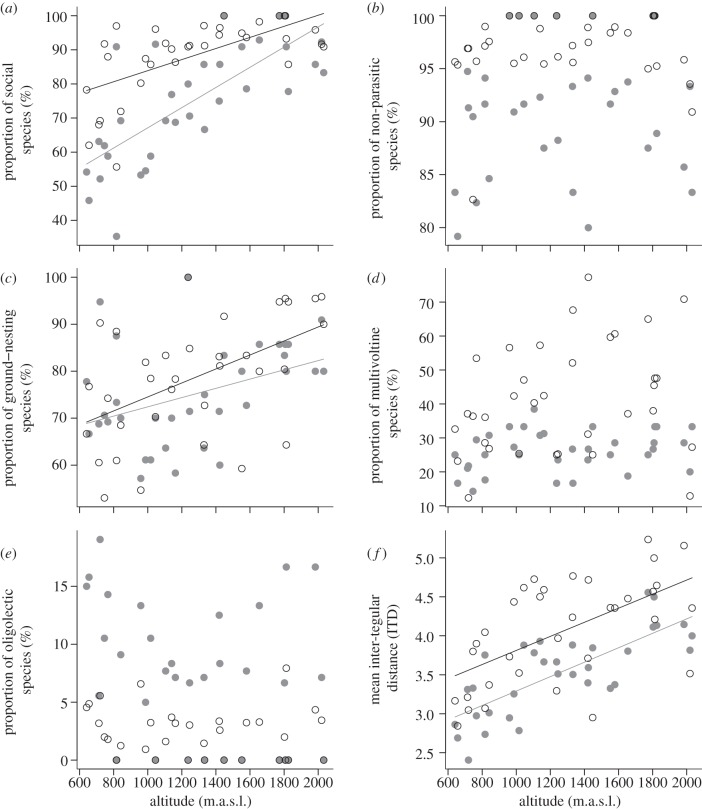
Figure 3.
Effects of altitude (m.a.s.l.) on the proportion (%) of five categorical life-history traits and on the mean ITD in wild bee communities on 34 sites. Black circles and lines represent abundance-weighted proportions/means of traits, whereas grey solid points and lines represent species-based proportions/means of traits. Lines are presented if simple regressions were significant (p < 0.05). The trait categories were: sociality (social versus solitary), parasitism (non-parasitic versus parasitic), nesting behaviour (below-ground versus above-ground-nesting), voltinism (multivoltine versus univoltine) and lecty (oligolectic versus polylectic).

