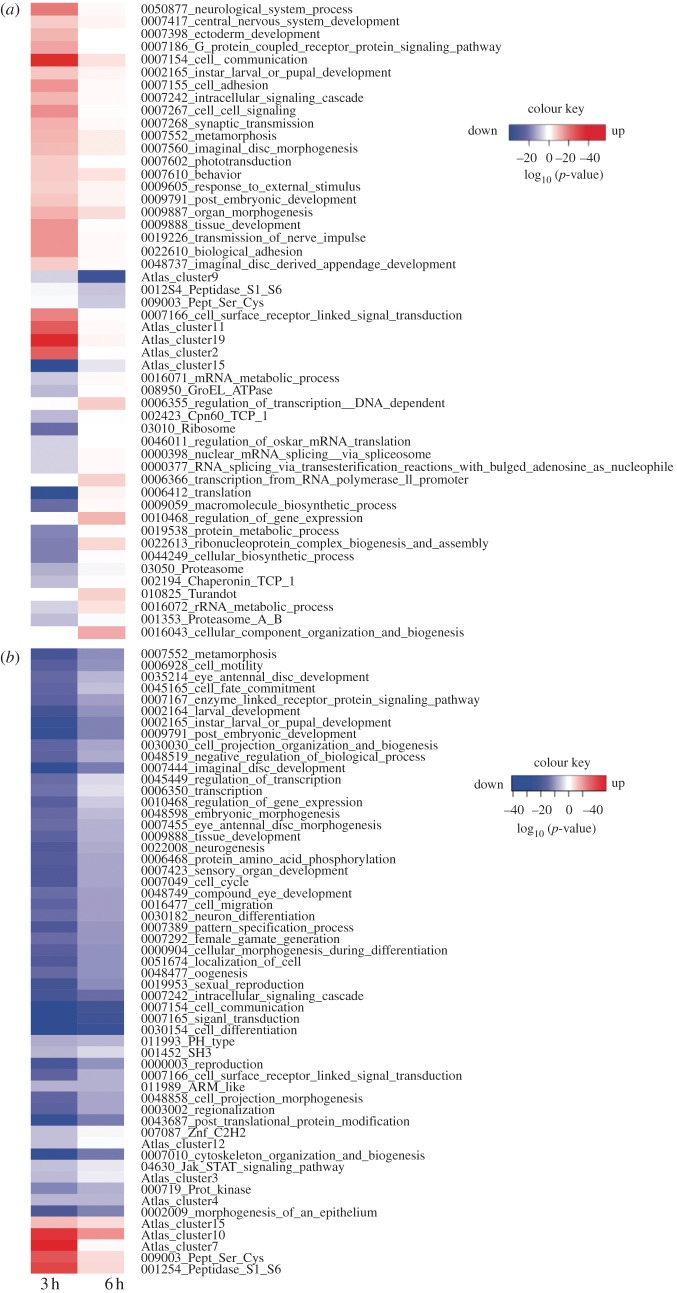
Figure 1.
Summary heat maps of adjusted p-values from Catmap analyses performed on (a) the head and thorax (HT) and (b) on the abdomen (Abd) datasets (full outputs are given in electronic supplementary material, table S2 and figures S1–S6). The colour key gives significance of p-values for significantly up (red) or down (blue) regulated gene categories. p-Values were log10-transformed in a positive and negative scale for up- and downregulated categories, respectively. The plotted categories include annotations for protein domains (six-digit InterPro identifiers), pathways (five-digit Kegg identifiers), Biological Process/BP terms (seven-digit GO identifiers) and results from the intersection with FlyAtlas tissue-specific gene clustering. Only categories with an adjusted p-value < 0.001 in at least one of the two time points (3, 6 h) are shown. Further editing of these categories was carried out in order to omit redundant terms and omit Flyatlas clusters that did not show evidence for specificity (expression peaks identified in more than four tissue types). For the Abd GO BP terms, comprising 218 categories with an adjusted p-value < 0.001, we selected 78 categories with a p-value < 10–14 prior to omission of redundant terms.

