Figure 6.
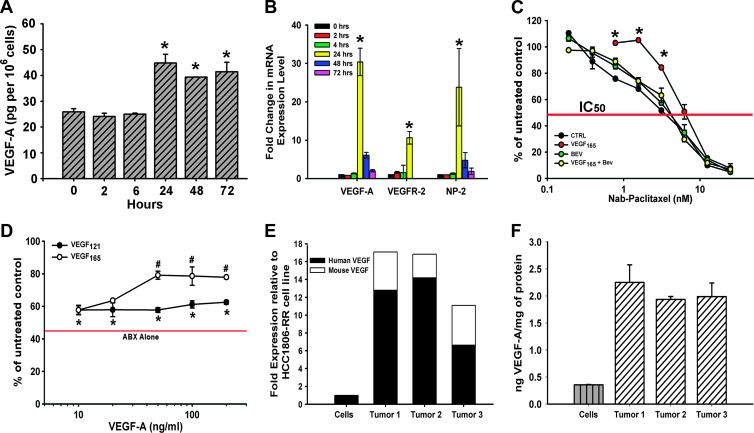
The effect of nab-paclitaxel on VEGF-A expression in HCC1806-RR cells in vitro. (A) ELISA was used to measure VEGF-A protein in conditioned medium of untreated HCC1806-RR cells (0 hours) and those treated for 2, 6, 24, 48, and 72 hours with nab-paclitaxel (10 nM). Statistically significant increases in secreted VEGF-A protein were detected at 24, 48, and 72 hours after initiation of cytotoxic treatment. VEGF-A secretion was measured in pg and normalized per 1 million cells. Each ELISA was performed in duplicate, and the experiment was reproduced twice yielding the mean presented values ± SD. (B) Untreated and nab-paclitaxel.treated HCC1806-RR cells were also quantitatively assessed for VEGF-A, VEGFR-2, and NP-2 transcript levels by RT-qPCR. Asterisks at 24 hours indicate a significant up-regulation of mRNA for both VEGF-A and its receptors, VEGFR-2, and NP-2 at a 24-hour time point. RT-qPCR assays were performed in duplicate wells and repeated three times. Results are presented as the mean values from three experiments ± SD. (C) HCC1806-RR cells were treated with nab-paclitaxel (0.19.25 nM) alone or in combination with 10 ng/ml VEGF-A165, 5 µg/ml bevacizumab, or a combination of all three. Statistically significant pro-survival shift by exogenous VEGF-A165 is indicated by asterisk (P < .001). Each point was performed in duplicate wells in two independent experiments and is represented as the mean value ± SD. (D) The pro-survival benefit of VEGF-A121 and VEGF-A165 was compared under constant nab-paclitaxel treatment (5 nM). The red bar indicates the IC50 of nab-paclitaxel alone. Asterisk indicates a statistically significant increase in survival from nab-paclitaxel alone to nab-paclitaxel treated with either VEGF-A121 or VEGF-A165. The symbol “#” indicates a statistically significant increase in enhanced survival between VEGF-A121 and VEGF-A165. Each assay was performed in duplicate wells and in two independent experiments, and the results are represented as the mean value ± SD. (E) Human and mouse VEGF-A levels were measured by RT-qPCR from HCC1806-RR cells and from three HCC1806-RR tumors. The black portion of the bar indicates the fold increase in human VEGF-A expression compared to the cells. The white portion indicates the increase in mouse transcript levels compared to the human VEGF-A expression from cultured cells. Each assay was performed in duplicate wells and repeated three times. (F) Protein expression for VEGF-A was compared from HCC1806-RR cells and from three HCC1806-RR tumors. Each bar represents the mean ng/mg protein of VEGF-A. Each ELISA was performed in duplicate and was repeated twice. Each bar is the mean VEGF-A expression ± SD.

