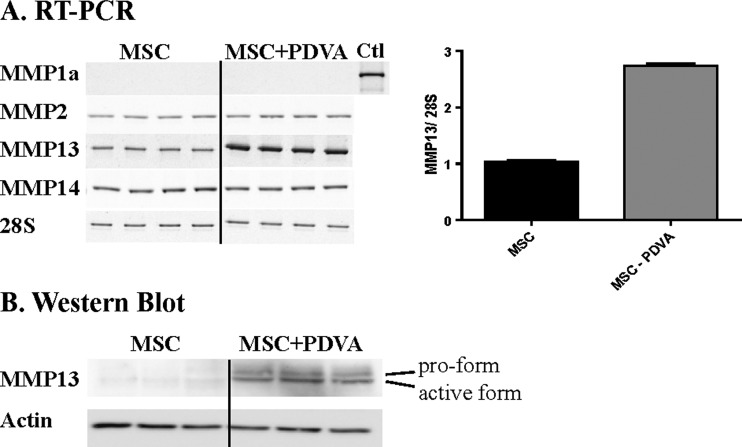
Figure 4.
Malignant keratinocytes stimulate MMP13 expression of MSC. (A) MSCs were cultured alone (MSC) or in the presence of an insert containing PDVA cancer cells (MSC + PDVA). (A) RT-PCR analyses of different MMPs. Quantification of MMP13 mRNA levels modulated upon MSC to cancer cell confrontation is expressed as a ratio between MMP13 mRNA and 28 rRNA (graph on the right panel). A positive control (corresponding to murine placenta) is shown for MMP1a mRNA analysis (Ctl). (B) Western blot analysis of MMP13 pro-form and active form expression by MSCs cultured with PDVA cells. Actin was used as a loading control.

