Abstract
The adaptive immune system relies on different cell types to provide fast and coordinated responses, characterized by recognition of pathogenic challenge, extensive cellular proliferation and differentiation, as well as death. T cells are a subset of the adaptive immune cellular pool that recognize immunogenic peptides expressed on the surface of antigen-presenting cells by means of specialized receptors on their membrane. T cell receptor binding to ligand determines T cell responses at different times and locations during the life of a T cell. Current experimental evidence provides support to the following: (i) sufficiently long receptor–ligand engagements are required to initiate the T cell signalling cascade that results in productive signal transduction and (ii) counting devices are at work in T cells to allow signal accumulation, decoding and translation into biological responses. In the light of these results, we explore, with mathematical models, the timescales associated with T cell responses. We consider two different criteria: a stochastic one (the mean time it takes to have had N receptor–ligand complexes bound for at least a dwell time, τ, each) and one based on equilibrium (the time to reach a threshold number N of receptor–ligand complexes). We have applied mathematical models to previous experiments in the context of thymic negative selection and to recent two-dimensional experiments. Our results indicate that the stochastic criterion provides support to the thymic affinity threshold hypothesis, whereas the equilibrium one does not, and agrees with the ligand hierarchy experimentally established for thymic negative selection.
1. Summary
The binding properties of T cell receptors for self-pMHC (peptide–major histocompatibility complex) ligands are the basis for the selection in the thymus of a useful (MHC-restricted) and safe (self-tolerant) T cell repertoire. There exists a wealth of experimental support for the following: (i) T cell receptors must be bound to their ligands for a sufficiently long time to initiate the T cell signalling cascade and (ii) T cells require T cell receptor signal accumulation, which will be translated into appropriate biological responses. We have made use of mathematical models to test two different hypotheses: (a) the timescale of a T cell response correlates with the time it takes to have had N receptor–ligand complexes bound for at least a threshold dwell time, τ, each and (b) the timescale of a T cell response correlates with the time a threshold number, N, of TCRs must be occupied at equilibrium. We demonstrate that scenario (a) provides, for a given T cell receptor, a ligand hierarchy that agrees with that experimentally established for thymic negative selection, and an intuitive way to understand self–non-self discrimination of pMHC ligand. Our results suggest that a very small number (fewer than 10) of cognate ligand molecules is sufficient to elicit a T cell response, which is consistent with the serial engagement model.
2. Introduction
The adaptive immune system relies on different cell types to provide fast and coordinated responses, characterized by recognition of the pathogenic challenge, extensive cellular proliferation (division) and differentiation, as well as cellular death. T cells are a subset of the adaptive immune cellular pool that recognize immunogenic peptides (non-covalently bound to MHC class I and class II molecules expressed on the surface of antigen-presenting cells (APCs)) by means of specialized receptor molecules on their membrane. A (human or mouse) T cell expresses about 30 000 copies [1] of a T cell receptor molecule (TCR), whose ligands (usually referred to as antigens, in this context) are complexes composed of a peptide bound to an MHC molecule (pMHC). T cell receptors are both degenerate (a given TCR can recognize different pMHC complexes) and specific (single or point mutations to a pMHC complex can significantly alter recognition); yet TCR–pMHC interactions have low affinities [2–6]. In vivo, pMHC complexes are expressed on the surface of APCs; each (human or mouse) APC displays around 100 000 different pMHC complexes on its surface [7–11]. It is through interactions with pMHC ligands that T cells become activated and differentiate into effector T cells, which elicit immune responses. Thus, in order to study the conditions under which T cells initiate a response, one needs to understand the dynamics of TCR–pMHC binding.
T cells are derived from precursor cells that migrate from the bone marrow to the thymus, where they rearrange their receptor genes and generate a unique (clonotypic) TCR. In the thymus, immature T cells (or thymocytes) are exposed to an antigenic micro-environment orchestrated by APCs of different types [12] that subject thymocytes to a ‘double test’ by displaying a wide range of pMHC complexes, with peptides derived from household proteins (self-peptides or self-pMHC complexes). Owing to the stochastic nature of the gene rearrangements [13,14], some TCRs will not be able to recognize a self-pMHC ligand (TCRs that are not functional). Other TCRs will recognize it too well, and could give rise to mature T cells with the potential to generate autoimmune responses. Thus, the need for a thymic double test to check the functionality of a thymocyte (positive selection) and its state of tolerance, so that it does not recognize self-pMHC complexes with high affinities (negative selection) [15]. Thymic selection allows only 2–5% of all thymocytes to survive and migrate to the peripheral sites of the immune system (lymph nodes, spleen, etc.) [16,17], where they continuously recirculate via the blood, surveying the antigenic environment displayed once again by APCs.
TCR–pMHC binding events determine T cell responses (survival, proliferation, differentiation or death) at different times and locations during the life of a T cell [18]. For example, Naeher et al. [19] have made use of a photo-affinity labelling system (that allows quantitative analysis of pMHC monomer binding to TCR) to show that MHC class I restricted TCRs exhibit an affinity threshold during negative selection. In the light of these results, it is natural to consider the question [20]: how does the number of TCR–pMHC-bound complexes relate to the outcome of negative selection? Current evidence suggests that both the duration and the number of TCR–pMHC bindings play a role [21–23]. Valitutti et al. [24,25] have experimentally shown that a few hundred pMHC molecules can serially bind thousands of TCRs. Finally, Sykulev et al. [26] and Davis and colleagues [27,28] have provided experimental data suggesting that a few agonist pMHC ligands (5–10) are sufficient to elicit a T cell response. This body of work provides support for the following two hypotheses: (i) TCR–pMHC engagement needs to be sufficiently long to result in productive signal transduction [29] and (ii) T cells can integrate signals; that is, counting devices are at work in T cells to allow signal accumulation, decoding and translation into biological responses [25]. These ideas have been explored by different groups: Palmer and Naeher have provided a biophysical basis for their affinity threshold for negative selection hypothesis [19,20], Dushek et al. [30] have developed a mathematical ‘productive hit rate model’, Chakraborty and colleagues [31–33] have developed statistical models of how T cells convert analogue inputs into digital outputs and van den Berg & Rand [34] have introduced the idea of a mean triggering rate. The first set of authors introduces the concepts of dwell time of individual TCR–pMHC complexes and productive TCR interactions, and compute the number of TCR–pMHC interactions required as a function of the TCR–pMHC complex half-life, for a given choice of dwell time and number of productive TCR interactions (see fig. 3 of Palmer & Naeher [20]). Current experimental evidence supports values of dwell time, τ, of around 4 s and number of productive TCR interactions, N, below 100 [20,35]. In this study, we make use of these ideas to provide a stochastic T cell response criterion based on a mathematical model of TCR–pMHC molecular interactions. The dynamics of a small number of TCR–pMHC binding events, as suggested by the experimental evidence mentioned earlier, is naturally described as a stochastic process, without the need to assume that TCR–pMHC association/dissociation kinetics has reached thermal equilibrium [36–41].
Figure 3.
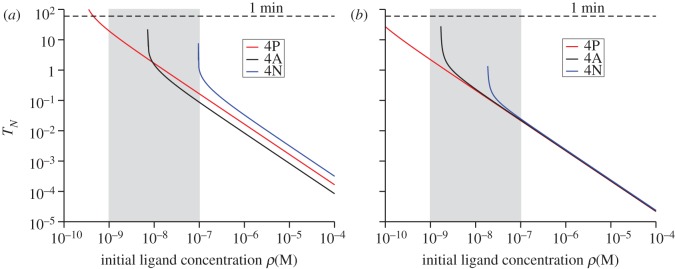
Equilibrium time, TN, with N = 10, using the deterministic model of §5.2. (a) Double positive thymocytes. (b) Single positive thymocytes. Time units are seconds. The physiologically relevant range of initial ligand concentration is shaded grey.
TCR–pMHC binding, and receptor–ligand binding in general, is described by reaction kinetics, assuming that the ligand is in solution and that receptors are membrane-bound on T cells [42,43]. The kinetics is governed, for a given choice of receptor and ligand, by two rates, k+ and k−, that give the probability per receptor and per unit of time of a binding and an unbinding event, respectively [36–39,44]. The study of reaction kinetics for the system A + B ⇋ C is not only limited to the case of receptor–ligand interactions, but is of wide interest and has been applied to other problems, such as crystal growth, gene clustering, cellular metabolism and catalytic efficiency of enzyme reactions [45–51]. From a thermodynamic perspective, it is natural to assume that, if one waits long enough, forward (association) and backward (dissociation) reactions reach a steady-state or equilibrium [34]. Thus, in §3, we investigate an equilibrium dynamics model of TCR–pMHC association/dissociation. One candidate T cell response criterion that will be explored is that the timescale of a T cell response correlates with the time a threshold number, N, of TCRs must be occupied at equilibrium, TN. However, given the experimental support behind the hypothesis that a few agonist pMHC ligands can suffice to trigger T cell responses [3,26,52] and Palmer's affinity threshold for negative selection [19,20,30], a stochastic approach seems more appropriate [38,39,53]. Furthermore and as discussed earlier, (i) sufficiently long TCR–pMHC engagements are required to initiate the signalling cascade, resulting in productive signal transduction [35], and (ii) T cells can integrate signals; that is, counting devices are at work in T cells to allow signal accumulation, decoding and translation into biological responses [25,23].
With this experimental and theoretical evidence in mind, we explore a different criterion, namely that T cell responses take place once a given number of TCRs (and not necessarily in a simultaneous way), N, have been engaged with ligand for at least a dwell time, τ, each. The stochastic criterion requires counting the number of productive bindings (a binding is productive if it lasts longer than the threshold dwell time, τ, to capture the essence of the signalling cascade [39]). The first time at which this stochastic criterion is satisfied (a first passage time (FPT), as considered from a stochastic process point of view [54]) will be referred here, and in a biological context, to as the (first) time to signal initiation (TSI). We will derive expressions for its mean value, or mean time to signal initiation (MTSI), T(N, τ), as a function of N, the number of productive TCR–pMHC engagements and τ, the dwell time, and its variance. We study the MTSI for different pMHC ligands, thymocytes and temperatures (both association and dissociation rates are temperature-dependent). We make use of recent data [19,55,56] to compare the equilibrium criterion versus the MTSI criterion, to explore the affinity threshold hypothesis and to confront two-dimensional and three-dimensional binding data with the stochastic criterion.
The study has the following structure: §3 describes the main results and in §4 we explore the immunological consequences of the results. Finally, in §5, we provide the mathematical details of the stochastic model developed, and how to derive the deterministic model as a limit of the stochastic model. We also provide analytical expressions for the mean and the variance of the TSI, as well as for the time to reach a threshold number N of receptor–ligand complexes, TN.
3. Results
3.1. Receptor–ligand binding dynamics
Our model of receptor–ligand binding is motivated by the experiments of Palmer and colleagues [19,20], measuring binding of soluble, monomeric pMHC ligands to live thymocytes from T1 TCR transgenic mice. The binding and unbinding reactions can be represented as follows:

where the circle represents a free ligand pMHC and the open box an unbound TCR.
We consider two different subsets of TCR transgenic T1 T cells (monoclonal TCR): pre-selection double positive thymocytes (DPs) and mature single positive thymocytes (SPs) [19]. DPs express on average NR = 3000 TCRs and SPs express on average NR = 30 000 TCRs on their surface. In the experiments, a panel of pMHC ligand complexes is used [19]. Here, we restrict ourselves to three, denoted 4P, 4A and 4N, whose binding parameters are given in table 1. The negatively selecting ligand, 4P, has the highest complex half-life, t1/2, and lowest equilibrium dissociation constant, Kd [44]. We note that the parameters Kd, t1/2 and kon have been introduced and defined in §5.2. The ligand denoted 4N is positively selecting, with the lowest t1/2 and highest Kd. The ligand denoted 4A is called a threshold ligand [19]; it can act as a positively selecting or negatively selecting ligand depending on its concentration [19]. For each ligand type and for a given temperature, the mathematical models require the association and dissociation rates for the TCR–pMHC interaction, k± (see §5 and Lauffenburger & Linderman [44]).
Table 1.
| cell type | ligand | Kd (M) | t1/2 (s) | kon (s−1 M−1) | k+ (s−1) | k− (s−1) |
|---|---|---|---|---|---|---|
| SP thymocyte | 4P at 37°C | 1.1 × 10⁻⁷ | 41 | 153 691 | 5.1230 × 10⁻¹⁰ | 0.0169 |
| SP thymocyte | 4A at 37°C | 5.5 × 10⁻⁶ | 0.8 | 157 533 | 5.2511 × 10⁻¹⁰ | 0.8664 |
| SP thymocyte | 4N at 37°C | 5.8 × 10⁻⁵ | 0.08 | 149 385 | 4.9795 × 10⁻¹⁰ | 8.6643 |
| DP thymocyte | 4P at 37°C | 8.8 × 10⁻⁸ | 39 | 201 966 | 6.7322 × 10⁻¹⁰ | 0.01778 |
| DP thymocyte | 4A at 37°C | 2.2 × 10⁻⁶ | 0.79 | 398 161 | 1.3272 × 10⁻⁹ | 0.8760 |
| DP thymocyte | 4N at 37°C | 2.9 × 10⁻⁵ | 0.23 | 105 719 | 3.5240 × 10⁻¹⁰ | 3.0658 |
Our criterion is that T cell responses are initiated by discrete (stochastic) events and not by attaining the state of thermal equilibrium or steady-state. In order to support our criterion, in §3.2, we explore a stochastic model of receptor–ligand binding, and in §3.3 we analyse the deterministic limit of the mathematical model. The distinction between deterministic and stochastic approaches is not solely a mathematical one, but a choice that has its roots in the biochemical distinction between equilibrium and non-equilibrium dynamics.
3.2. Stochastic criterion for T cell responses
We first study the possibility that immunological responses of T cells are determined by the number of TCRs engaged for a minimum threshold time [20]. In order to explore this scenario, we develop a stochastic model of TCR binding to pMHC ligand, described in §5.1. We are interested in calculating the time it takes a T cell to reach (for the first time and not necessarily in a simultaneous fashion) N TCR engagements with pMHC ligands, such that each engagement lasts at least a dwell time τ. This time defines the stochastic criterion of T cell responses and is denoted in what follows the first time to signal initiation (or TSI). The first time to signal initiation (or time to signal initiation, for short) is analogous to a FPT defined in stochastic dynamical systems [49,57]. We note the following implicit assumptions of the stochastic criterion: binding events, as well as unbinding events are considered independent and identically distributed random variables [58,59], and the times to bind, as well as the times to unbind are considered exponentially distributed random processes (see §5.1 for mathematical definitions and choice of notation). In §5.1, we provide analytical expressions for the mean and the variance of the time to signal initiation.
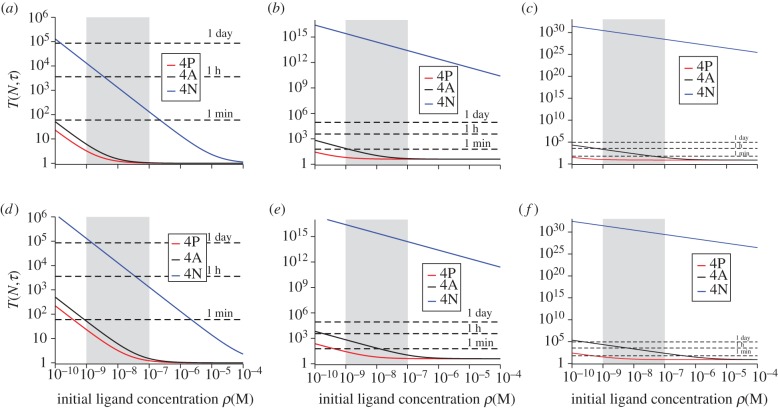
We now make use of the T1 TCR data described in Naeher et al. [19] for three different pMHC ligands (4P negatively selecting ligand, 4A threshold ligand, 4N positively selecting ligand) and summarized in table 1. In figure 1, we plot T(N,τ) for SP thymocytes, as a function of the initial ligand concentration, for different values of N and τ (see §5.1 for mathematical definitions and choice of notation).
Figure 1.
Mean time to signal initiation (MTSI) for a T cell according to the stochastic criterion. MTSI, T(N,τ), for single positive thymocytes (SP), T1 TCRs at 37 degrees. Different panels stand for different pairs of values (N,τ): (a) for (10,1), (b) for (10,4), (c) for (10,8), (d) for (100,1), (e) for (100,4) and (f) for (100,8). Time units are seconds. The physiologically relevant range of initial ligand concentration is shaded grey, and the dotted lines correspond to a time scale of 1 min, 1 h and 1 day, respectively.
From figure 1 (supported by equation (3.1)), we note the following properties of the MTSI.
-
—
For any value of the initial ligand concentration, and for any choice of N and τ, the stochastic criterion yields the shortest time to respond to the ligand 4P and the largest time to respond to the ligand 4N, in agreement with the experimental data of Naeher et al. [19]. Furthermore, 4A (or threshold ligand) displays in all cases (figure 1) an intermediate behaviour. Thus, the MTSI provides qualitative support to the affinity threshold hypothesis introduced in Naeher et al. [19]. Given an initial ligand concentration, a choice for (N, τ) and a time T for a T cell response, the positively selecting ligand will not be able to initiate a response within a immunologically relevant time.
-
—
There is no reversion of the hierarchy of ligands as a function of the initial ligand concentration.
-
—
An increase in either N or τ increases the value of MTSI.
-
—
As the temperature increases, the MTSI also increases (data not shown).
We now proceed to present our results in greater detail.
3.2.1. For single positive thymocytes the mean time to signal initiation is shorter when binding the negatively selecting ligand
We have considered different scenarios, firstly for SP thymocytes [20,35]: (a) N = 10 bindings and τ = 1 s, (b) N = 10 bindings and τ = 4 s, (c) N = 10 bindings and τ = 8 s, (d) N = 100 bindings and τ = 1 s, (e) N = 100 bindings and τ = 4 s and (f) N = 100 bindings and τ = 8 s. We compare the mean T cell response times (MTSI) of a positively selecting ligand (4N), a threshold ligand (4A) and a negative selecting ligand (4P), for varying initial ligand concentrations for the TCR system T1. As seen in figure 1, the negative-selecting ligand is characterized by the shortest MTSI in all cases considered. This is a result of both its higher kon and lower koff, which means bindings occur more frequently and are more likely to last longer. This also accounts for the more pronounced differences in MTSI when either the threshold time, τ, is increased from 1 to 8 s or when the number of bindings required, N, is increased from 10 to 100.
A consequence of the stochastic criterion is that, the larger the number of bindings required, N, the less important stochastic effects become. In this case, the coefficient of variation tends to zero as N increases (see equation (5.17)). Immunologically, this is relevant as the criterion relegates N to a role secondary to that of the dwell time τ. (For example, compare panels a and b (change in τ) and panels a and d (change in N) in figure 1.)
3.3. Equilibrium time to N TCR–pMHC complexes
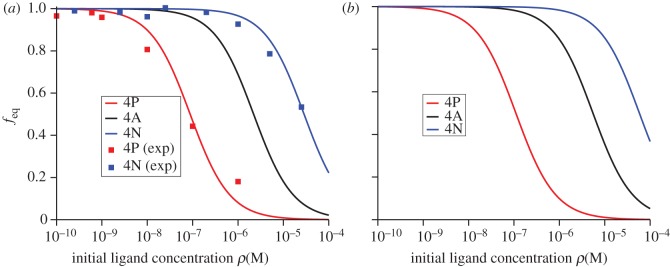
If one was to assume that ligand hierarchy or potency (for a given TCR) is determined by how rapidly thermal equilibrium of TCR–pMHC complexes is established, it would be natural to compare the dose–response binding curves for the different ligands under consideration [19]. In figure 2, we plot feq (see §5.2), the fraction of free TCR molecules at equilibrium, as a function of the initial ligand concentration (dose–response) for different ligands and for DPs (a) and SPs (b). These curves, which have been computed making use of the equations derived in §5.2, agree with the experimental equilibrium binding curves of Naeher et al. [19].
Figure 2.
Fraction of unbound T cell receptor at equilibrium, feq, computed making use of the equations derived in §5.2. (a) Double positive thymocytes. (b) Single positive thymocytes. Squares are the experimental measured values provided in Naeher et al. [19].
We now continue to explore the equilibrium dynamics of receptor–ligand binding with a second T cell response criterion. We introduce TN, the time needed to reach N TCR–pMHC complexes. In §5.2, we derive an expression for TN from the solution of an ordinary differential equation [44]. This criterion is, to some extent, the deterministic version of the stochastic criterion that we have introduced in the previous section. In figure 3, we show the time to reach N = 10 TCR–pMHC complexes for both double and single positive thymocytes (figure 3a and b, respectively).
Inspection of both the DP and SP thymocytes cases (figure 3a and b, respectively), clearly indicates that this second equilibrium criterion does not allow discrimination between ligands for intermediate to high initial ligand concentrations. That is, for a large range of initial concentrations, this criterion cannot distinguish between positively and negatively selecting ligands, contradicting what has been experimentally found in Naeher et al. [19]. Thus, this criterion cannot account for the hierarchy of activity of peptides observed in vivo [19]. Furthermore, for low enough concentrations, there is an abrupt change in the behaviour of the ligands 4N and 4A, as TN becomes unbound, that is, for these two ligands, TN becomes uncontrollably large, and for small initial concentrations these two ligands will not reach N TCR–pMHC complexes in a finite amount of time. This behaviour shifts towards higher concentrations as the value of N increases. The immunological implications of this criterion are: for high concentrations, all the ligands elicit the same response and thus TN behaves as an all-or-nothing T cell response mechanism. If we were to include the condition that each TCR–pMHC complex needs to remain bound for a minimum dwell time (defined later as τ), this would only shift the curves by an amount τ vertically.
In the case of DP thymocytes, figure 3a, the implications of this equilibrium criterion are even more disappointing as the roles of 4P and 4A are reversed and the threshold ligand 4A becomes the negatively selecting ligand. Both implications are in disagreement with the hierarchy of ligands experimentally determined [19,20].
From an immunological perspective, and as a function of the initial concentration of ligand, one expects the following behaviour [19,20]: (i) for large enough concentrations (above the physiological range), negatively selecting ligands remain negatively selecting, positively selecting ligands remain positively selecting and threshold ligands become negatively selecting, and (ii) for physiological concentrations, negatively selecting ligands remain negatively selecting, positively selecting ligands remain positively selecting and threshold ligands remain threshold. We can conclude that this behaviour is well characterized by the stochastic criterion introduced in §3.2 (see, figure 1b,c or figure 6b,c) but is at odds with the equilibrium criterion discussed in this section.
Figure 6.
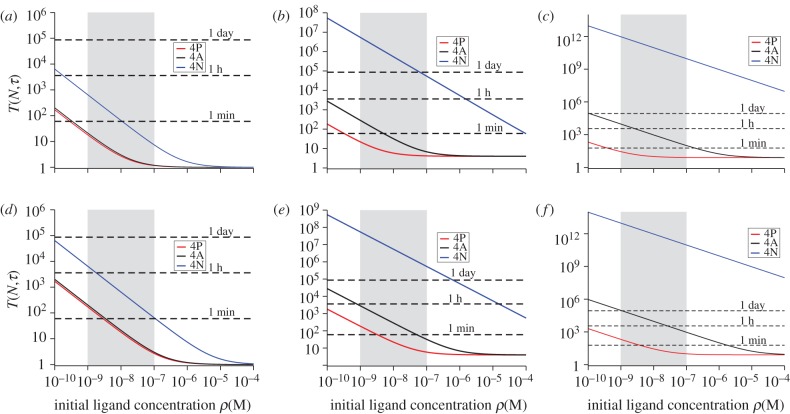
Mean time to signal initiation (MTSI) for a T cell according to the stochastic criterion. MTSI, T(N, τ), for double positive thymocytes (DP), T1 TCRs at 37 degrees. Different panels stand for different pairs of values (N, τ): (a) for (10, 1), (b) for (10, 4), (c) for (10, 8), (d) for (100, 1), (e) for (100, 4) and (f) for (100, 8). Time units are seconds. The physiologically relevant range of initial ligand concentration is shaded grey, and the dotted lines correspond to a time scale of 1 min, 1 h and 1 day, respectively.
3.4. Statistics of the mean time to signal initiation
Here, we introduce the equation for the time it takes a T cell to reach (for the first time and not necessarily in a simultaneous fashion) N TCR engagements with pMHC ligands, such that each engagement lasts at least a dwell time τ. We also explore the implications of this equation for the MTSI (which is in the theory of stochastic processes a mean FPT [58]), T(N,τ), as a function of its relevant parameters (at a given temperature). The relevant parameters are the initial pMHC ligand concentration, ρ, the average number of TCRs expressed on the surface of a T cell, NR, and the association and dissociation rates for a given pMHC ligand. As derived in §5.3, the MTSI is given by
 |
3.1 |
The previous equation can be intuitively understood as follows. The probability that, once engaged, a receptor stays engaged for at least a time τ is exp(−τkoff). The mean number of complexes formed such that N of them remain bound for longer than τ is N′ = exp(τkoff)N. Note that T(N,τ) is always a decreasing function of ρ and kon, but an increasing function of koff. In the limit of very small initial ligand concentration, we have  . In the limit of large initial ligand concentration, we have
  . In §5, we have also derived the following analytical expression for the variance of the MTSI, as a function of N and τ:
 |
3.2 |
The predictions of (3.1) are in excellent agreement with the exact numerical simulations (see §5) as can be seen in figure 4, which provides a comparison between the numerical simulations and the theoretical predictions of (3.1) and (3.2).
Figure 4.
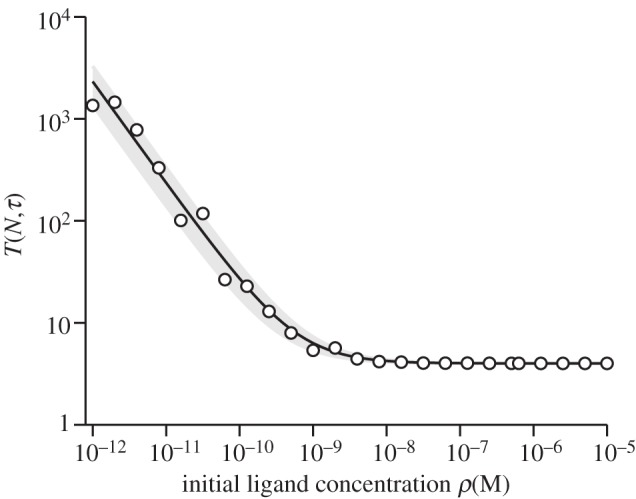
Mean time to signal initiation, T(N,τ), for N = 10 and τ = 4 s, as a function of the initial ligand concentration. The ligand is 4P and the T cells are SPs. The solid line represents T(N,τ), calculated with the analytical expression (3.1), and the shaded area is one standard deviation, calculated with the analytical expression (3.2). The open circles represent T(N,τ), numerically calculated with just one computational run (see §5.4). Time units are seconds.
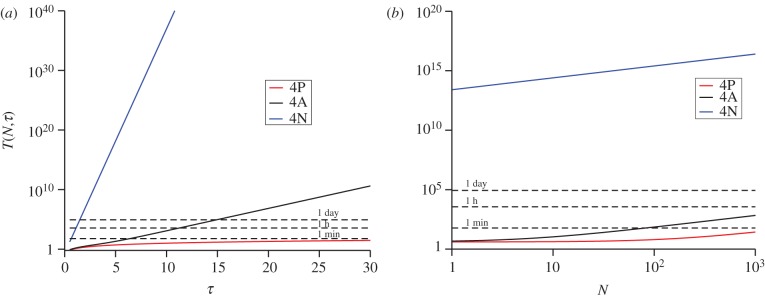
In figure 5, we explore the dependence of T(N,τ), given an initial ligand concentration, as a function of τ (for fixed N) and as a function of N (for fixed τ). The left panel (figure 5a) illustrates the dramatic difference in T(N,τ) based on small differences in koff. As predicted by equation (3.1), T(N,τ) depends linearly on N (figure 5b).
Figure 5.
Mean time to signal initiation according to the stochastic criterion. MTSI, T(N,τ), for single positive thymocytes (SP), T1 TCRs at 37 degrees. (a) MTSI as a function of τ with N = 10 and (b) MTSI as a function of N with τ = 4 s. (a,b) The initial ligand concentration has been set equal to ρ = 10−8 M. Time units are seconds.
We conclude this section with a final application of the stochastic criterion to the problem of ligand self–non-self discrimination. In the spirit of the example discussed by van der Merwe & Dushek [35] (box 1), we study the implications of the MTSI formula to illustrate the possibility of self–non-self discrimination. Suppose that ligand F ‘foreign’ has koff = 1.0 s−1 and ligand S ‘self’ has koff = 5.0 s−1, that both have the same value of kon, but the concentration of S is 100 times that of F. If konNRρ = 10 s−1 for F, and if konNRρ = 1000 s−1 for S, then T(10, 4) = 59 s for F and T(10, 4) = 5 × 10⁶ s for S. In this example, the stochastic criterion produces very clear self–non-self discrimination.
3.5. Pre-selection DPs versus SPs
We now explore the MTSI hypothesis on pre-selection DP thymocytes, which have 10-fold lower average number of TCRs on their surface than SP thymocytes. We also note that the binding rates (for a fixed temperature) are different for SP and DP thymocytes (table 1). We have made use of the three different ligands (4P, 4A and 4N) of the T1 TCR system [19]. Our results are summarized in figure 6. DPs are not as capable of discriminating between negatively selecting and threshold ligands as SPs at low initial pMHC ligand concentrations.
As can be seen from plots (a) and (d), with τ = 1 s, the stochastic criterion does not distinguish between 4P (negatively selecting) and 4A (threshold). The ability to discriminate at 37 degrees improves if we choose τ = 4 s, (figure 6b,e). These results suggest that if negative selection happens too early (at the pre-selection DP stage), it might not be effective, as pre-selection DPs will not distinguish between signals delivered by positively selecting ligands and negatively selecting ligands. Threshold ligands, such as 4A, are expected to behave as positively selecting ligands at low concentration, but as negatively selecting ligands at high concentration, as experimentally shown [19,20].
3.6. Two-dimensional binding data: stochastic T cell response criterion
Single-molecule microscopy and fluorescence resonance energy transfer [55], as well as adhesion frequency and thermal fluctuations assays [56] are recent alternative methods of quantifying TCR–pMHC binding, with the advantage that both molecules are anchored on cell surfaces [35,55,56,60]. Recent experimental kinetic parameters (such as kon and koff), measured in such two-dimensional conditions [55,56], are given in tables 2 and 6.
Table 2.
A summary of in situ (two-dimensional) binding data taken from Huppa et al. [55] from the experimental CD4+ 2B4 TCR mouse model.
 |
In this section, we explore the stochastic criterion in light of these recent two-dimensional measurements. Note that the stochastic criterion allows us to consider both scenarios (two- and three-dimensional), as follows.
- For two-dimensional binding (receptor and ligand molecules anchored on cell membranes), with number densities of receptor and ligand MR, ML, respectively, Ac the area of contact between the cells, and kon(two-dimensional) and koff(two-dimensional) the two-dimensional on and off rates, respectively, the MTSI is given by
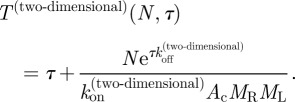
3.3 - For three-dimensional binding (receptor molecules anchored on cell membrane and ligand in solution), with ligand concentration ρ, number of receptors on the cell surface NR and kon(three-dimensional) and koff(three-dimensional) the three-dimensional on and off rates, respectively, the mean MTSI is given by

3.4
We make use of the stochastic criterion with experimental data, measured in a two-dimensional context, from earlier studies [55,56]. Let us assume that given a TCR, ligand potency correlates inversely with the value of T(N,τ), that is, the most potent ligand for the given TCR is that with the smallest value of the MTSI. We note that for a chosen value of τ, the ligand hierarchy does not depend on N, as can be seen from (3.3) and (3.4).
The experimental set-up of Huppa et al. [55] is for the CD4+ 2B4 TCR mouse model and for the IEk/MCC ligand at different temperatures. We have considered their binding data for different temperatures and both in situ and in vitro conditions [55] (tables 2 and 3). The stochastic criterion (with N = 10 and τ ∈ [1,10] s) has been used to rank the experimental data (fixed ligand at different temperatures) according to their MTSI values (tables 4 and 5). If we assume that the MTSI correlates with the time of a T cell response, and thus, with the potency of the ligand,1 the stochastic criterion implies that it is only for τ > 5 s when both in situ (two-dimensional) and in vitro (three-dimensional) binding data agree on ligand potency (or hierarchy). In this case, and for τ > 5 s, it is the lowest temperature that yields the shortest MTSI, and as the temperature is increased, the MTSI increases. A plausible way to reconcile both in situ and in vitro data is to hypothesize that the early intracellular molecular steps of the T cell signalling cascade (a kinetic proof-reading mechanism [52,61–63]), require at least a time τ > 5 s.
Table 3.
A summary of in vitro (three-dimensional) binding data taken from Huppa et al. [55] from the experimental CD4+ 2B4 TCR mouse model.
 |
Table 4.
Each row is the ligand ranking, for a given value of τ, according to the stochastic criterion for the parameters in table 2. The first ranking ligand corresponds to the shortest MTSI. The parameters and colour scheme correspond to the in situ experiments of table 2.
 |
Table 5.
Each row is the ligand ranking, for a given value of τ, according to the stochastic criterion for the parameters in table 2. The first ranking ligand corresponds to the shortest MTSI. The parameters and colour scheme correspond to the in vitro experiments of table 3.
 |
The experimental set-up of Huang et al. [56] is for the CD8+ OT1 TCR mouse model and six different ligands. We have considered their two-dimensional binding data [56] (table 6), and the three-dimensional binding data of Gascoigne et al. [64] (table 7). The stochastic criterion (with N = 10 and τ ∈ [1,10] s) has been used to rank the experimental data (six different ligands at a given temperature) according to their MTSI values (tables 8 and 9). If we assume that the MTSI correlates with the time of a T cell response, and, thus, with the potency of the ligand, the stochastic criterion suggests that the two-dimensional and three-dimensional hierarchies are very different. The three-dimensional hierarchy does not change, except for a switch at  s, when V-OVA and R4 interchange their rankings. On the other hand, the two-dimensional hierarchy depends a lot on the value of τ. We note that the hierarchy of ligands for τ < 1 s is almost an inversion of the hierarchy that gets established for values of τ greater than 6 s. This is not surprising, given the negative correlation between two-dimensional and three-dimensional off-rates reported by Huang et al. [56].
Table 6.
A summary of two-dimensional binding data taken from Huang et al. [56] for the CD8+ OT1 TCR experimental mouse model.
 |
Table 7.
A summary of three-dimensional binding data taken from [64] for the CD8+ OT1 TCR experimental mouse model.
 |
Table 8.
Each row is the ligand ranking, for a given value of τ, according to the stochastic criterion for the parameters in table 6. The first ranking ligand corresponds to the shortest MTSI. The parameters and colour scheme correspond to the two-dimensional experiments of table 6.
 |
Table 9.
Each row is the ligand ranking, for a given value of τ, according to the stochastic criterion for the parameters in table 7. The first ranking ligand corresponds to the shortest MTSI. The parameters and colour scheme correspond to the three-dimensional experiments of table 7.
 |
4. Discussion
T cell receptor binding to ligand determines T cell responses at different times and locations during the life of a T cell [15]. Current experimental evidence, as reviewed in Valitutti et al. [25], provides support to the following: (i) sufficiently long receptor–ligand engagements are required to initiate the T cell signalling cascade that results in productive signal transduction, and (ii) counting devices are at work in T cells to allow signal accumulation, decoding and translation into biological responses. In other words, both the duration and number of TCR–pMHC bindings play a role in T cell responses [21,30]. These ideas have already been explored by Palmer & Naeher [20] in order to provide a biophysical basis for their affinity threshold for negative selection hypothesis [19]. The authors introduce the concepts of dwell time of individual TCR–pMHC complexes and productive TCR interactions, and compute the number of TCR–pMHC interactions required as a function of the TCR–pMHC complex half-life, for a given choice of dwell time and number of productive TCR interactions (see fig. 3 of Palmer & Naeher [20]). In light of these results, and the fact that in the thymus SP thymocytes only have 4–5 days to scan the medullary environment [12,65,66] and in the periphery the dose- and time-dependence of antigen localization determine whether protective immunity is induced or not [67], in this study we have explored, with mathematical models, the timescales associated with T cell responses. We have considered two different criteria: a stochastic one—(i) the mean time (or mean FPT) it takes to have had N receptor–ligand complexes bound for at least a dwell time, τ, each— and one based on equilibrium—(ii) the time a threshold number, N, of TCRs are occupied at equilibrium. The dynamics of a small number of TCR–pMHC binding events is naturally described as a stochastic process, without the need to assume that TCR–pMHC association/dissociation kinetics has reached thermal equilibrium [36–40]. We have applied both the deterministic and stochastic criteria to the experimental data presented in Naeher et al. [19]. Our results indicate that the stochastic criterion provides support to the thymic affinity threshold hypothesis suggested by Palmer [19,20], whereas the equilibrium one does not. Thus, we propose as a timescale associated to T cell responses: the first time at which the stochastic criterion is satisfied, which is referred to as an FPT in the theory of stochastic processes [58], but has been referred to as the first time to signal initiation in this study. Furthermore, other properties of the stochastic criterion are (i) for the values of N and τ considered, the calculated MTSIs are of the order of the timescales associated to negative selection and T cell activation, (ii) a very small number (fewer than 10) of cognate ligand molecules is sufficient to elicit a T cell response, which is consistent with the serial engagement model, (iii) it provides an intuitive way to understand self–non-self discrimination, (iv) it relegates N to a secondary role to that of the dwell time, τ, which is consistent with the kinetic proof-reading model, and (v) it can be applied to either two- or three-dimensional binding data. Our results indicate that for the experimental data of Huppa et al. [55] one can identify a threshold dwell time, τ, for TCR–pMHC complexes of 5 s that can account for the same ligand hierarchy for both in situ and in vitro data. For the data reported by Huang et al. [56], we note that the two-dimensional hierarchy, as determined by the stochastic criterion, is extremely sensitive to the value of τ: the hierarchy of ligands for τ < 1 s is almost an inversion of the hierarchy that gets established for values of τ greater than 6 s. This is not surprising, given the negative correlation between two-dimensional and three-dimensional off-rates reported by the authors.
The previous discussion also stresses one of the main results of this study, namely that stochastic effects are important in the timescales that determine cellular responses: during thymic negative selection [12,65,66] or during the initiation of T cell responses in the periphery [67].
As discussed in Altan-Bonnet & Germain [52], rapid, sensitive and highly discriminatory TCR-induced signals, yet exquisitely ligand specific, can be explained in terms of a negative feedback (phosphatase mediated), which suppresses signalling by weak ligands, and a positive feedback (ERK mediated), which is induced by strong TCR–pMHC ligands. Furthermore, recent work by Dushek et al. [63] has considered the role of TCR–pMHC rebinding, within a kinetic proofreading model [61,62], as a potential mechanism for pMHC ligand discrimination. In this study, we have not attempted to provide a mechanistic derivation of the dwell time, τ, introduced in the stochastic criterion. The mechanisms discussed in earlier studies [52,63,68] will allow us to explore different kinetic proofreading scenarios and feedback loops, to justify the origin of τ. This and TCR/pMHC diffusion on cellular membranes [69] will be considered elsewhere.
We conclude by summarizing the mathematical results of this study: we have made use of a stochastic model for the binding and unbinding kinetics of receptor–ligand interactions [38], that is a birth and death stochastic process for the number of receptor–ligand complexes. This model has allowed us to formulate the stochastic criterion and to derive analytical expressions for the mean value of TSI, T(N,τ) as a function of N and τ, and its variance.
5. Methods
5.1. Stochastic model
We study the dynamics of monovalent receptor binding to monomeric ligand with a stochastic model that is represented as follows:

An unbound receptor can bind a free ligand with rate k+, and an engaged receptor can become dissociated from the ligand with rate k−. Both k± have units of inverse time. At the initial time, t = 0, all MR receptors are unbound, and there are ML free ligands. The stochastic variable Xt represents the number of engaged receptors at time t. Its state space S is given by the set  . The dynamics of the stochastic variable Xt (number of engaged receptors at time t) can be derived from the transition probabilities that prescribe the events that can take place in a small time interval. There are only two types of events:
an association event that increases the number of engaged receptors by one unit, and
a dissociation event that reduces the number of engaged receptors by one unit.
The stochastic model for the binding and unbinding of receptors and ligands is a continuous time Markov chain, a birth and death process [58,70] with rates
 |
Let pn(t) be the probability that there are n engaged receptors at time t. That is,  . These probabilities satisfy the following system of differential equations [70]:
| 5.1 |
 |
| 5.3 |
where we have assumed that MR ≤ ML. Similar equations can be derived in the case MR > ML. The mean number of engaged receptors at time t is  .
.
It obeys the following differential equation:
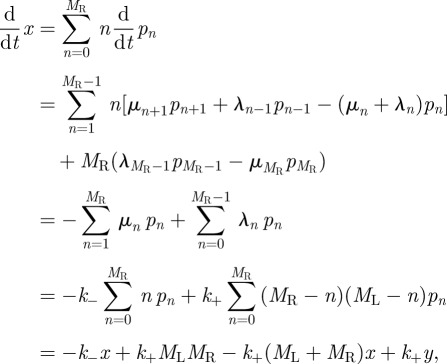 |
5.4 |
where  .
.
If the experimental system under consideration has a number, Nc, of T cells, each of them with an average number, NR, of TCRs on their surface, the mean number of engaged receptors per T cell at time t is given by
| 5.5 |
Let us introduce the stochastic variable, Zt, such that Xt = NcZt, and the variable  . If we make use of these definitions and the fact that MR = NcNR, it is easy to derive the following equation for the time evolution of z(t):
 |
5.6 |
5.2. Deterministic approximation
The deterministic approximation consists of neglecting fluctuations in equation (5.6) by setting w(t) = z2(t), so that dz/dt = f(z), where
 |
5.7 |
The two solutions of f(z) = 0 are z1 and z2, where
 |
5.8 |
 |
5.9 |
and
 |
5.10 |
As  ,
,  , the stable steady-state value [44]. We also introduce the per T cell fraction of unbound receptors in the steady-state, given by
  . The exact solution of equation (5.6), z(t), with initial conditions, z(0) = 0, is given by
 |
An important quantity that is obtained from this solution is the time to reach N TCR–pMHC complexes, that is, TN, such that z(TN) = N. TN can be computed to yield:
 |
5.2.1. Ordinary differential equation under the assumption of soluble ligand binding
We may rewrite equation (5.6) as
 |
where we have introduced the following parameters:
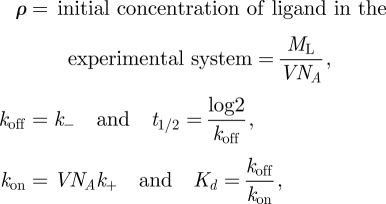 |
with V the volume of the experiment and NA Avogadro's number.
The deterministic approximation consists of neglecting fluctuations by setting y(t) = x2(t), or w(t) = z2(t), so that
 |
5.11 |
If we introduce
 |
then the solution of equation (5.6), with z(0) = 0, is given by
 |
5.12 |
From this solution, one can obtain the equilibrium value of the average number of engaged receptors per T cell, zeq, and TN. These are given by the following expressions:
| 5.13 |
and
 |
5.14 |
5.3. The mean and variance of the first passage time (or first time to signal initiation)
We now suppose that T cell responses take place once N TCRs have been engaged with ligand, for at least a time τ each. The first time at which this criterion is satisfied is referred to as a FPT [58]. We will derive expressions for its mean value, T(N,τ), and variance.
At the instant of its formation, any ligand–receptor complex has probability  of remaining bound for longer than the dwell time τ. A binding that does so is said to be productive. Let
  be the mean total number of binding events before the Nth productive one. We can then write (as binding events are independent)
Let ti be the time that the ith ligand–receptor complex is formed. By definition, we have that FPT(N, τ) = τ+ tN′ and thus,  Each of the N′ times between binding events, ti+1 − ti, is exponentially distributed and therefore has standard deviation equal to its mean [58]. The time tN′, which is a sum of exponentially distributed random times, therefore has variance proportional to N′. If, up to time tN′, the number of bound receptors is much less than NR and much less than ρVNA/Nc, then tN′ is the sum of N′ independent, exponentially distributed random variables with mean (konρNR)−1, that is
 |
5.15 |
so that
 |
5.16 |
Note that the coefficient of variation of the FPT can be computed as follows:
 |
5.17 |
With more generality, we may assume that the initial concentration of ligands, ρ, is constant (neglect ligand depletion due to binding), but take into account that the number of occupied TCRs on a T cell is a finite fraction of NR. The total number of receptors that bind at least once before time t is NR [1 − exp(−konρt)]. Let B(t) be the mean number of bound receptors at time t. Then, we can write
| 5.18 |
and if we solve for B(t), we have
| 5.19 |
The mean number of binding events up to time t is C(t), where
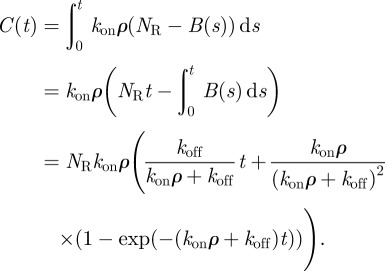 |
5.20 |
If  , then
  . Setting C(T − τ) = N′ gives the following expression for T:
 |
which includes correction terms to the approximation of T(N, τ) calculated in (5.16). Note that the correction terms become negligible when  . For the values of N considered in this study, the correction terms can be neglected, as has been verified in numerical computations.
We conclude by providing, without derivation, the analytical expressions for the mean and the variance of the FPT in a two-dimensional setting. It is easy to show that
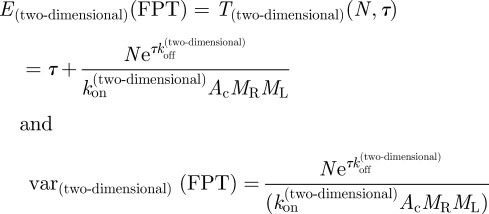 |
5.21 |
5.4. Numerical simulation method
We use the stochastic simulation, or Gillespie algorithm [71,72], where the number of bound ligands as a function of time, in each realization, is explicitly generated. If there are n bound ligands at time t, then the first event after time t is either binding, with probability λn /(λn + μn), or unbinding, with probability μn /(λn + μn ). The time at which the event occurs is t = Δt, where Δt is a random variable and  s > 0. We study the dynamics of the receptor–ligand system using parameters k+, k−, NR and ML corresponding to the ligands 4P, 4A and 4N. Binding and unbinding times are recorded, and a realization ends when the stochastic criterion (N bindings that last, for at least, a time τ each) is first satisfied. By averaging over realizations, we are able to compute mean FPTs and coefficients of variation.
Acknowledgements
M.C., G.L. and C.M.P. acknowledge hospitality at LANL (wonderful environment for great discussions), where the manuscript was drafted during our visit in August 2010. G.L. and C.M.P. acknowledge hospitality at IISc, as during our visit in August 2011 the manuscript was finished. We are grateful for discussions with José Faro, Omer Dushek, Thomas Höfer, David Kranz, Jennifer Stone and Balbino Alarcón. CMP thanks Edgar Delgado-Eckert for careful reading of the manuscript. This work has been partially supported through grants nos. FIS2009-12964-C05-03 (MC), FP7 PIRSES-GA-2008-230665 (M.C., G.L. and C.M.P.), BBSRC BB/F003811/1 (G.L. and C.M.P.), BBSRC BB/G023395/1 (C.M.P.) and EPSRC studentship EP/P504228/1 (J.C.). We would like to express our gratitude to the referees, whose valuable comments improved the manuscript.
Footnotes
References
- 1.Coombs D., Kalergis A., Nathenson S., Wofsy C., Goldstein B. 2002. Activated TCRs remain marked for internalization after dissociation from pMHC. Nat. Immunol. 3, 926–931. 10.1038/ni838 ( 10.1038/ni838) [DOI] [PubMed] [Google Scholar]
- 2.Stone J., Chervin A., Kranz D. 2009. T-cell receptor binding affinities and kinetics: impact on T-cell activity and specificity. Immunology 126, 165–176. 10.1111/j.1365-2567.2008.03015.x ( 10.1111/j.1365-2567.2008.03015.x) [DOI] [PMC free article] [PubMed] [Google Scholar]
- 3.Ebert P., Li Q., Huppa J., Davis M. 2010. Functional development of the T Cell receptor for antigen. Prog. Mol. Biol. Trans. Sci. 92, 65–100. 10.1016/S1877-1173(10)92004-8 ( 10.1016/S1877-1173(10)92004-8) [DOI] [PMC free article] [PubMed] [Google Scholar]
- 4.Košmrlj A., Jha A., Huseby E., Kardar M., Chakraborty A. 2008. How the thymus designs antigen-specific and self-tolerant T cell receptor sequences. Proc. Natl Acad. Sci. USA 105, 16 671–16 676. 10.1073/pnas.0808081105 ( 10.1073/pnas.0808081105) [DOI] [PMC free article] [PubMed] [Google Scholar]
- 5.Lyons D. S., Lieberman S. A., Hampl J., Boniface J. J, Chien Y., Berg L. J., Davis M. M. 1996. A TCR binds to antagonist ligands with lower affinities and faster dissociation rates than to agonists. Immunity 5, 53–61. 10.1016/S1074-7613(00)80309-X ( 10.1016/S1074-7613(00)80309-X) [DOI] [PubMed] [Google Scholar]
- 6.Lanzavecchia A., Lezzi G., Viola A. 1999. From TCR engagement to T cell activation: a kinetic view of T cell behavior. Cell 96, 1–4. 10.1016/S0092-8674(00)80952-6 ( 10.1016/S0092-8674(00)80952-6) [DOI] [PubMed] [Google Scholar]
- 7.Yewdell J., Reits E., Neefjes J. 2003. Making sense of mass destruction: quantitating MHC class I antigen presentation. Nat. Rev. Immunol. 3, 952–961. 10.1038/nri1250 ( 10.1038/nri1250) [DOI] [PubMed] [Google Scholar]
- 8.Stevanovic S., Schild H. 1999. Quantitative aspects of T cell activation–peptide generation and editing by MHC class I molecules. Semin. Immunol. 11, 375–384. 10.1006/smim.1999.0195 ( 10.1006/smim.1999.0195) [DOI] [PubMed] [Google Scholar]
- 9.Rammensee H., Falk K., Rötzschk O. 1993. Peptides naturally presented by MHC class I molecules. Annu. Rev. Immunol. 11, 213–244. 10.1146/annurev.iy.11.040193.001241 ( 10.1146/annurev.iy.11.040193.001241) [DOI] [PubMed] [Google Scholar]
- 10.Hunt D., Henderson R., Shabanowitz J., Sakaguchi K., Michel H., Sevilir N., Cox A., Appella E., Engelhard V. 1992. Characterization of peptides bound to the class I MHC molecule HLA-A2. 1 by mass spectrometry. Science 255, 1261–1263. 10.1126/science.1546328 ( 10.1126/science.1546328) [DOI] [PubMed] [Google Scholar]
- 11.Tsomides T., Walker B., Eisen H. 1991. An optimal viral peptide recognized by CD8+ T cells binds very tightly to the restricting class I major histocompatibility complex protein on intact cells but not to the purified class I protein. Proc. Natl Acad. Sci USA 88, 11 276–11 280.( 10.1073/pnas.88.24.11276) [DOI] [PMC free article] [PubMed] [Google Scholar]
- 12.Klein L. 2009. Dead man walking: how thymocytes scan the medulla. Nat. Immunol. 10, 809–811. 10.1038/ni0809-809 ( 10.1038/ni0809-809) [DOI] [PubMed] [Google Scholar]
- 13.Janas M., Varano G., Gudmundsson K., Noda M., Nagasawa T., Turner M. 2010. Thymic development beyond β-selection requires phosphatidylinositol 3-kinase activation by CXCR4. J. Exp. Med. 207, 247–261. 10.1084/jem.20091430 ( 10.1084/jem.20091430) [DOI] [PMC free article] [PubMed] [Google Scholar]
- 14.Goldrath A., Bevan M. 1999. Selecting and maintaining a diverse T-cell repertoire. Nature 402, 6–13. [DOI] [PubMed] [Google Scholar]
- 15.Palmer E. 2003. Negative selection: clearing out the bad apples from the T-cell repertoire. Nat. Rev. Immunol. 3, 383–391. 10.1038/nri1085 ( 10.1038/nri1085) [DOI] [PubMed] [Google Scholar]
- 16.Palmer E. 2006. The T-cell antigen receptor: a logical response to an unknown ligand. J. Recept. Signal Transduct. Res. 26, 367–378. 10.1080/10799890600919094 ( 10.1080/10799890600919094) [DOI] [PubMed] [Google Scholar]
- 17.van Meerwijk J., Marguerat S., Lees R., Germain R., Fowlkes B., MacDonald H. R. 1997. Quantitative impact of thymic clonal deletion on the T cell repertoire. J. Exp. Med. 185, 377–384. 10.1084/jem.185.3.377 ( 10.1084/jem.185.3.377) [DOI] [PMC free article] [PubMed] [Google Scholar]
- 18.Petrie H., Zúñiga-Pflücker J. 2007. Zoned out: functional mapping of stromal signaling microenvironments in the thymus. Annu. Rev. Immunol. 25, 649–679. 10.1146/annurev.immunol.23.021704.115715 ( 10.1146/annurev.immunol.23.021704.115715) [DOI] [PubMed] [Google Scholar]
- 19.Naeher D., Daniels M., Hausmann B., Guillaume P., Luescher I., Palmer E. 2007. A constant affinity threshold for T cell tolerance. J. Exp. Med. 204, 2553–2559. 10.1084/jem.20070254 ( 10.1084/jem.20070254) [DOI] [PMC free article] [PubMed] [Google Scholar]
- 20.Palmer E., Naeher D. 2009. Affinity threshold for thymic selection through a T-cell receptor-co-receptor zipper. Nat. Rev. Immunol. 9, 207–213. 10.1038/nri2469 ( 10.1038/nri2469) [DOI] [PubMed] [Google Scholar]
- 21.Labrecque N., Whitfield L. S., Obst R., Waltzinger C., Benoist C., Mathis D. 2001. How much TCR does a T cell need? Immunity 15, 71–82. 10.1016/S1074-7613(01)00170-4 ( 10.1016/S1074-7613(01)00170-4) [DOI] [PubMed] [Google Scholar]
- 22.Hofmann M. et al. 2004. T cell avidity determines the level of CTL activation. Eur. J. Immunol. 34, 1798–1806. 10.1002/eji.200425088 ( 10.1002/eji.200425088) [DOI] [PubMed] [Google Scholar]
- 23.Corse E., Gottschalk R., Allison J. 2011. Strength of TCR–peptide/MHC interactions and in vivo T cell responses. J. Immunol. 186, 5039–5045. 10.4049/jimmunol.1003650 ( 10.4049/jimmunol.1003650) [DOI] [PubMed] [Google Scholar]
- 24.Valitutti S., Müller S., Cella M., Padovan E., Lanzavecchia A. 1995. Serial triggering of many T-cell receptors by a few peptide MHC complexes. Nature 375, 148–151. 10.1038/375148a0 ( 10.1038/375148a0) [DOI] [PubMed] [Google Scholar]
- 25.Valitutti S., Coombs D., Dupré L. 2010. The space and time frames of T cell activation at the immunological synapse. FEBS lett. 584, 4851–4857. 10.1016/j.febslet.2010.10.010 ( 10.1016/j.febslet.2010.10.010) [DOI] [PubMed] [Google Scholar]
- 26.Sykulev Y., Joo M., Vturina I., Tsomides T., Eisen H. 1996. Evidence that a single peptide–MHC complex on a target cell can elicit a cytolytic T cell response. Immunity 4, 565–571. 10.1016/S1074-7613(00)80483-5 ( 10.1016/S1074-7613(00)80483-5) [DOI] [PubMed] [Google Scholar]
- 27.Irvine D. J, Purbhoo M. A., Krogsgaard M., Davis M. M. 2002. Direct observation of ligand recognition by T cells. Nature 419, 845–849. 10.1038/nature01076 ( 10.1038/nature01076) [DOI] [PubMed] [Google Scholar]
- 28.Huppa J. B., Davis M. M. 2003. T-cell-antigen recognition and the immunological synapse. Nat. Rev. Immunol. 3, 973–983. 10.1038/nri1245 ( 10.1038/nri1245) [DOI] [PubMed] [Google Scholar]
- 29.Rosette C., Werlen G., Daniels M., Holman P., Alam S., Travers P. J., Gascoigne N. R. J., Palmer E., Jameson S. C. 2001. The impact of duration versus extent of TCR occupancy on T cell activation: a revision of the kinetic proofreading model. Immunity 15, 59–70. 10.1016/S1074-7613(01)00173-X ( 10.1016/S1074-7613(01)00173-X) [DOI] [PubMed] [Google Scholar]
- 30.Dushek O. et al. 2011. Antigen potency and maximal efficacy reveal a mechanism of efficient T cell activation. Sci. Signal. 4, ra39. 10.1126/scisignal.2001430 ( 10.1126/scisignal.2001430) [DOI] [PMC free article] [PubMed] [Google Scholar]
- 31.Das J., Ho M., Zikherman J., Govern C., Yang M., Weiss A., Chakraborty A. K., Roose J. P. 2009. Digital signaling and hysteresis characterize ras activation in lymphoid cells. Cell 136, 337–351. 10.1016/j.cell.2008.11.051 ( 10.1016/j.cell.2008.11.051) [DOI] [PMC free article] [PubMed] [Google Scholar]
- 32.Chakraborty A., Košmrlj A. 2010. Statistical mechanical concepts in immunology. Annu. Rev. Phys. Chem. 61, 283–303. 10.1146/annurev.physchem.59.032607.093537 ( 10.1146/annurev.physchem.59.032607.093537) [DOI] [PubMed] [Google Scholar]
- 33.Chakraborty A., Das J. 2010. Pairing computation with experimentation: a powerful coupling for understanding T cell signalling. Nat. Rev. Immunol. 10, 59–71. 10.1038/nri2688 ( 10.1038/nri2688) [DOI] [PubMed] [Google Scholar]
- 34.Van Den Berg H., Rand D. 2007. Quantitative theories of T-cell responsiveness. Immunol. Rev. 216, 81–92. 10.1111/j.1600-065X.2006.00491.x ( 10.1111/j.1600-065X.2006.00491.x) [DOI] [PubMed] [Google Scholar]
- 35.van der Merwe P., Dushek O. 2010. Mechanisms for T cell receptor triggering. Nat. Rev. Immunol. 11, 47–55. 10.1038/nri2887 ( 10.1038/nri2887) [DOI] [PubMed] [Google Scholar]
- 36.McQuarrie D. 1963. Kinetics of small systems. I. J. Chem. Phys. 38, 433–436. 10.1063/1.1733676 ( 10.1063/1.1733676) [DOI] [Google Scholar]
- 37.McQuarrie D., Jachimowski C., Russell M. 1964. Kinetics of small systems. II. J. Chem. Phys. 40, 2914–2921. 10.1063/1.1724926 ( 10.1063/1.1724926) [DOI] [Google Scholar]
- 38.McQuarrie D. 1967. Stochastic approach to chemical kinetics. J. Appl. Probab. 4, 413–478. 10.2307/3212214 ( 10.2307/3212214) [DOI] [Google Scholar]
- 39.Coombs D., Dushek O., Merwe P. 2011. A review of mathematical models for T cell receptor triggering and antigen discrimination. In Mathematical models and immune cell biology (eds Molina-París C., Lythe G.), pp. 25–45. Berlin, Germany: Springer. [Google Scholar]
- 40.Stone J., Cochran J., Stern L. 2001. T-cell activation by soluble MHC oligomers can be described by a two-parameter binding model. Biophys. J. 81, 2547–2557. 10.1016/S0006-3495(01)75899-7 ( 10.1016/S0006-3495(01)75899-7) [DOI] [PMC free article] [PubMed] [Google Scholar]
- 41.Stone J., Artyomov M., Chervin A., Chakraborty A., Eisen H., Kranz D. M. 2011. Interaction of streptavidin-based peptide–MHC oligomers (tetramers) with cell-surface TCRs. J. Immunol. 187, 6281–6290. 10.4049/jimmunol.1101734 ( 10.4049/jimmunol.1101734) [DOI] [PMC free article] [PubMed] [Google Scholar]
- 42.Aleksic M., Dushek O., Zhang H., Shenderov E., Chen J., Cerundolo V., Coombs D., Anton van der Merwe P. 2010. Dependence of T cell antigen recognition on T cell receptor–peptide MHC confinement time. Immunity 32, 163–174. 10.1016/j.immuni.2009.11.013 ( 10.1016/j.immuni.2009.11.013) [DOI] [PMC free article] [PubMed] [Google Scholar]
- 43.Govern C., Paczosa M., Chakraborty A., Huseby E. 2010. Fast on-rates allow short dwell time ligands to activate T cells. Proc. Natl Acad. Sci. 107, 8724–8729. 10.1073/pnas.1000966107 ( 10.1073/pnas.1000966107) [DOI] [PMC free article] [PubMed] [Google Scholar]
- 44.Lauffenburger D., Linderman J. 1996. Receptors: models for binding, trafficking, and signaling. Oxford, UK: Oxford University Press. [Google Scholar]
- 45.Drews T., Katsoulakis M., Tsapatsis M. 2005. A mathematical model for crystal growth by aggregation of precursor metastable nanoparticles. J. Phys. Chem. B 109, 23879–23887.( 10.1021/jp0537299) [DOI] [PubMed] [Google Scholar]
- 46.Svetic R., MacCluer C., Buckley C., Smythe K., Jackson J. 2004. A metabolic force for gene clustering. Bull. Math. Biol. 66, 559–581. 10.1016/j.bulm.2003.09.008 ( 10.1016/j.bulm.2003.09.008) [DOI] [PubMed] [Google Scholar]
- 47.Kierzek A. 2002. STOCKS: STOChastic Kinetic Simulations of biochemical systems with Gillespie algorithm. Bioinformatics 18, 470–481. 10.1093/bioinformatics/18.3.470 ( 10.1093/bioinformatics/18.3.470) [DOI] [PubMed] [Google Scholar]
- 48.Yang J., Hlavacek W. 2011. Scaffold-mediated nucleation of protein signaling complexes: elementary principles. Math. Biosci. 232, 164–173. 10.1016/j.mbs.2011.06.003 ( 10.1016/j.mbs.2011.06.003) [DOI] [PMC free article] [PubMed] [Google Scholar]
- 49.Gardiner C. 1985. Stochastic methods. Berlin, Germany: Springer. [Google Scholar]
- 50.van Kampen N. 2007. Stochastic processes in physics and chemistry. Amsterdam, The Netherlands: North-Holland. [Google Scholar]
- 51.Gillespie D. 1992. Markov processes: an introduction for physical scientists. New York, NY: Academic Press. [Google Scholar]
- 52.Altan-Bonnet G., Germain R. 2005. Modeling T cell antigen discrimination based on feedback control of digital ERK responses. PLoS Biol. 3, e356. 10.1371/journal.pbio.0030356 ( 10.1371/journal.pbio.0030356) [DOI] [PMC free article] [PubMed] [Google Scholar]
- 53.Lipniacki T., Hat B., Faeder J. R., Hlavacek W. S. 2008. Stochastic effects and bistability in T cell receptor signaling. J. Theor. Biol. 254, 110–122. 10.1016/j.jtbi.2008.05.001 ( 10.1016/j.jtbi.2008.05.001) [DOI] [PMC free article] [PubMed] [Google Scholar]
- 54.Grimmett G., Stirzaker D. 2001. Probability and random processes. Oxford, UK: Oxford University Press. [Google Scholar]
- 55.Huppa J., Axmann M., Mörtelmaier M., Lillemeier B., Newell E., Brameshuber M., Klein L. O., Schüz G. J., Davis M. M. 2010. TCR–peptide–MHC interactions in situ show accelerated kinetics and increased affinity. Nature 463, 963–967. 10.1038/nature08746 ( 10.1038/nature08746) [DOI] [PMC free article] [PubMed] [Google Scholar]
- 56.Huang J., Zarnitsyna V., Liu B., Edwards L., Jiang N., Evavold B. D., Zhu C. 2010. The kinetics of two dimensional TCR and pMHC interactions determine T cell responsiveness. Nature 464, 932–936. 10.1038/nature08944 ( 10.1038/nature08944) [DOI] [PMC free article] [PubMed] [Google Scholar]
- 57.Redner S. 2001. A guide to first-passage processes. Cambridge, UK: Cambridge University Press. [Google Scholar]
- 58.Taylor H., Karlin S. 1998. An introduction to stochastic modeling. New York, NY: Academic Press. [Google Scholar]
- 59.Zarnitsyna V., Huang J., Zhang F., Chien Y., Leckband D., Zhu C. 2007. Memory in receptor–ligand-mediated cell adhesion. Proc. Natl Acad. Sci. USA 104, 18037–18042.( 10.1073/pnas.0704811104) [DOI] [PMC free article] [PubMed] [Google Scholar]
- 60.Robert P., Aleksic M., Dushek O., Cerundolo V., Bongrand P., van der Merwe P. A. 2012. Kinetics and mechanics of two-dimensional interactions between T cell receptors and different activating ligands. Biophys. J. 102, 248–257. 10.1016/j.bpj.2011.11.4018 ( 10.1016/j.bpj.2011.11.4018) [DOI] [PMC free article] [PubMed] [Google Scholar]
- 61.Mckeithan T. 1995. Kinetic proofreading in T-cell receptor signal transduction. Proc. Natl Acad. Sci USA 92, 5042–5046. 10.1073/pnas.92.11.5042 ( 10.1073/pnas.92.11.5042) [DOI] [PMC free article] [PubMed] [Google Scholar]
- 62.Salazar C., Höfer T. 2009. Multisite protein phosphorylation–from molecular mechanisms to kinetic models. FEBS J. 276, 3177–3198. 10.1111/j.1742-4658.2009.07027.x ( 10.1111/j.1742-4658.2009.07027.x) [DOI] [PubMed] [Google Scholar]
- 63.Dushek O., Das R., Coombs D. 2009. A role for rebinding in rapid and reliable T cell responses to antigen. PLoS Comput. Biol. 5, e1000578. 10.1371/journal.pcbi.1000578 ( 10.1371/journal.pcbi.1000578) [DOI] [PMC free article] [PubMed] [Google Scholar]
- 64.Gascoigne N., Zal T., Alam S. 2001. T-cell receptor binding kinetics in T-cell development and activation. Expert Rev. Mol. Med. 2, 1–17. [DOI] [PubMed] [Google Scholar]
- 65.Werlen G., Hausmann B., Naeher D., Palmer E. 2003. Signaling life and death in the thymus: timing is everything. Science 299, 1859–1863. 10.1126/science.1067833 ( 10.1126/science.1067833) [DOI] [PubMed] [Google Scholar]
- 66.Bevan M. 1997. In thymic selection, peptide diversity minireview gives and takes away. Immunity 7, 175–178. 10.1016/S1074-7613(00)80520-8 ( 10.1016/S1074-7613(00)80520-8) [DOI] [PubMed] [Google Scholar]
- 67.Zinkernagel R., Ehl S., Aichele P., Oehen S., Kündig T., Hengartner H. 1997. Antigen localisation regulates immune responses in a dose-and time-dependent fashion: a geographical view of immune reactivity. Immunol. Rev. 156, 199–209. 10.1111/j.1600-065X.1997.tb00969.x ( 10.1111/j.1600-065X.1997.tb00969.x) [DOI] [PubMed] [Google Scholar]
- 68.Wedagedera J., Burroughs N. 2006. T-cell activation: A queuing theory analysis at low agonist density. Biophys. J. 91, 1604–1618. 10.1529/biophysj.105.066001 ( 10.1529/biophysj.105.066001) [DOI] [PMC free article] [PubMed] [Google Scholar]
- 69.Dushek O., Coombs D. 2008. Analysis of serial engagement and peptide-MHC transport in T cell receptor microclusters. Biophys. J. 94, 3447–3460. 10.1529/biophysj.107.116897 ( 10.1529/biophysj.107.116897) [DOI] [PMC free article] [PubMed] [Google Scholar]
- 70.Allen L. 2003. An introduction to stochastic processes with applications to biology. Englewood Cliffs, NJ: Prentice Hall. [Google Scholar]
- 71.Gillespie D. 1977. Exact stochastic simulation of coupled chemical reactions. J. Phys. Chem. 81, 2340–2361. 10.1021/j100540a008 ( 10.1021/j100540a008) [DOI] [Google Scholar]
- 72.Gillespie D. 1992. A rigorous derivation of the chemical master equation. Physica A 188, 404–425. 10.1016/0378-4371(92)90283-V ( 10.1016/0378-4371(92)90283-V) [DOI] [Google Scholar]


