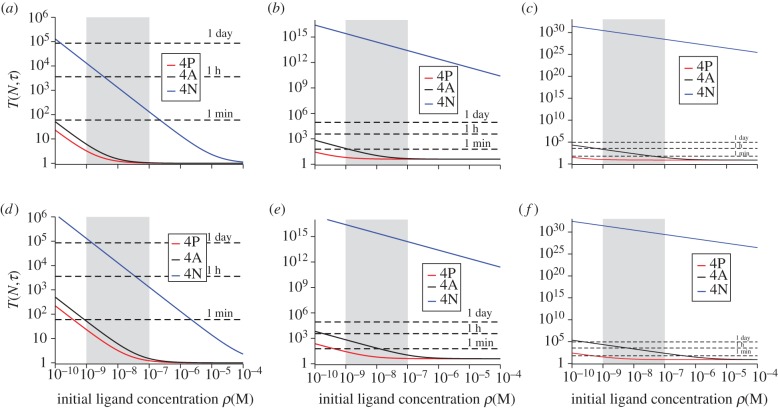
Figure 1.
Mean time to signal initiation (MTSI) for a T cell according to the stochastic criterion. MTSI, T(N,τ), for single positive thymocytes (SP), T1 TCRs at 37 degrees. Different panels stand for different pairs of values (N,τ): (a) for (10,1), (b) for (10,4), (c) for (10,8), (d) for (100,1), (e) for (100,4) and (f) for (100,8). Time units are seconds. The physiologically relevant range of initial ligand concentration is shaded grey, and the dotted lines correspond to a time scale of 1 min, 1 h and 1 day, respectively.

