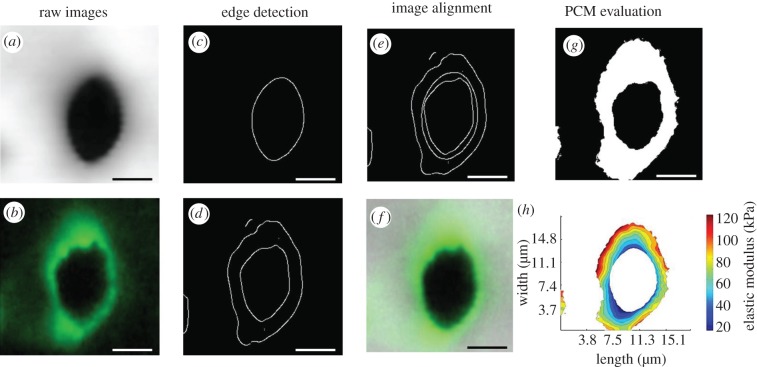
Figure 2.
An image analysis was performed in Mathematica to align stiffness maps and IF images for PCM data analysis. The inner edge of cell-sized voids was detected in (a) topographical maps and (b) IF images using (c,d) edge detection. The topographical map was translated in the x- and y-directions to minimize the distance between it and the IF image (e). Stiffness maps and IF images were cropped for alignment as needed (shown overlaid in f). Aligned IF images were thresholded and converted to binary masks to determine regions of positive IF-labelling (g). IF-positive masks and elastic moduli contour maps were analysed in Matlab to extract PCM moduli from each scan region (h). Scale bars, 5 µm. (Online version in colour.)

