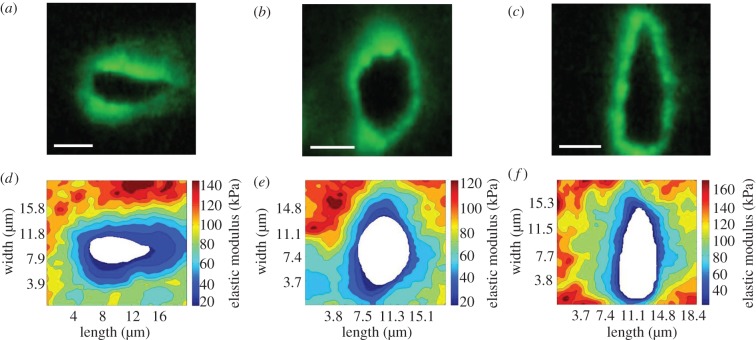
Figure 3.
Stiffness mapping of the PCM in the (a,d) superficial, (b,e) middle and (c,f) deep zones of articular cartilage. (a–c) Representative IF images showing the distribution of type VI collagen around cell-sized voids in each zone. (d–f) Representative contour maps of calculated elastic moduli of PCM scan regions in each zone. The spatial distribution of type VI collagen co-localized with softer modulus regions within each scan. Scale bars, 5 µm. (Online version in colour.)

