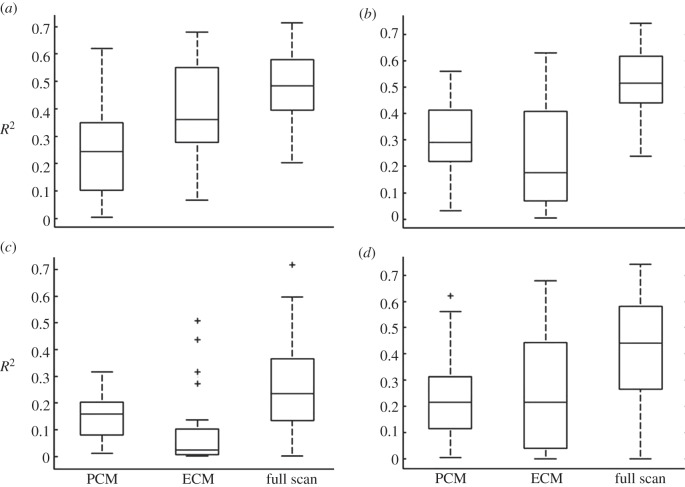
Figure 6.
Box plots of coefficient of determination (r2) for linear regression of elastic modulus versus relative fluorescence intensity for each PCM scan region in the (a) superficial, (b) middle, (c) deep zones and (d) across all zones. Separate regression analyses were performed on PCM regions alone, ECM regions alone and the full scan region (PCM + ECM). Median r2 value is designated by the horizontal line within each box.

