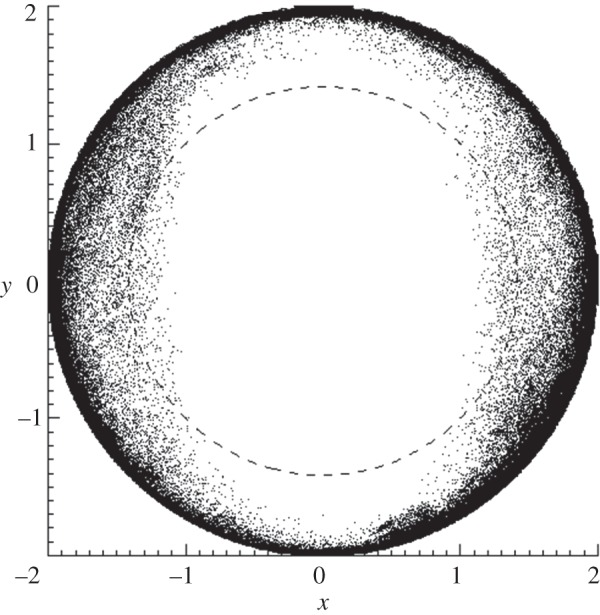
Figure 12.

Head marker direction for a freely moving rat. Lambert azimuthal equal-area projection (LAP) plot showing the distribution of head marker directions for approximately 300 min of freely moving rat tracking data collected using the two-tracker configuration. Units are arbitrary.
