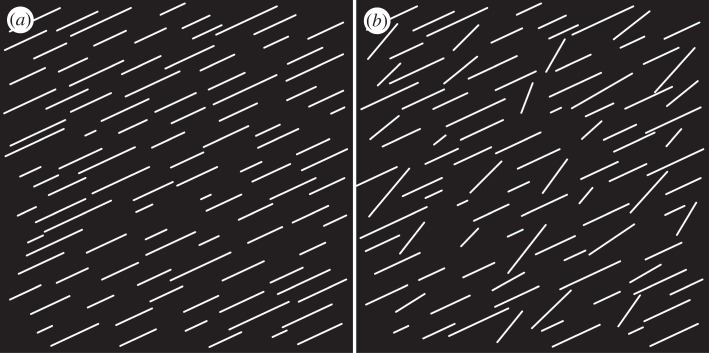
Figure 1.
Two binary test images, each 1511×1511 pixels, containing 100 randomly distributed straight lines with varying lengths according to a Gaussian distribution (s.d.: 35%). In (a), all lines are oriented at 25° (0° is circumferential); in (b), 30% of the lines have been randomly rotated to match a Gaussian distribution with a mean of 45° and a s.d. of 10°.

