Figure 3.
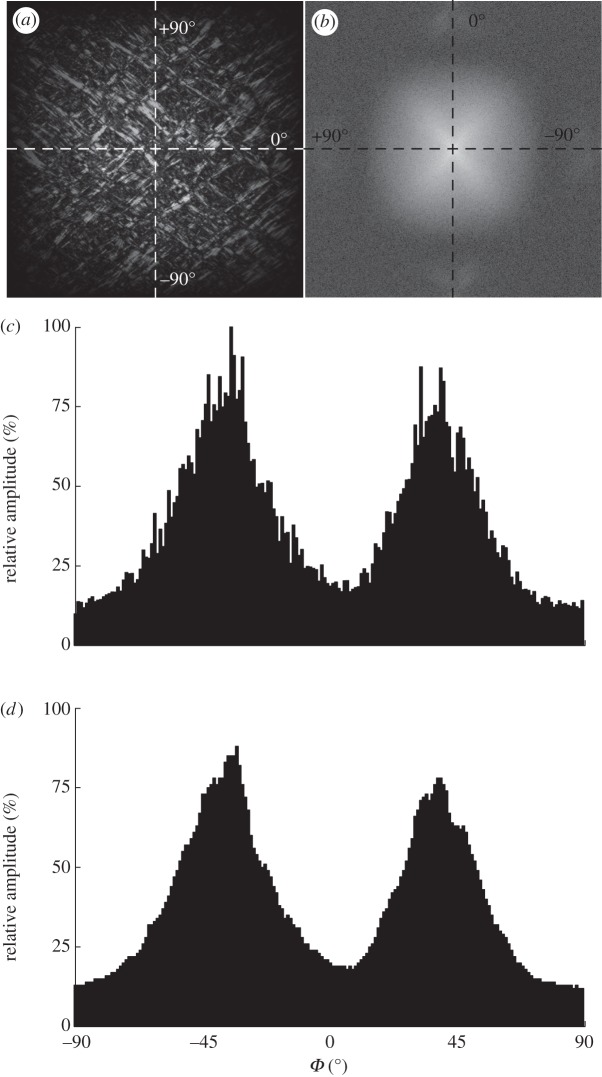
(a) The windowed greyscale image of the intima, as shown in figure 2a. (b) The Fourier power spectrum of (a), visualized with a logarithmic intensity scale and the lowest frequency at the origin. (c) The discrete angular distribution of relative amplitudes I(Φ) of the windowed greyscale image, obtained through 1° wedge filtering of the power spectrum shown in (b). (d) The effect of smoothing the amplitudes using a moving average filter with a span range of 5°. The frequency components in (a) of the collagen fibres along different orientations are represented in (b) as changes in amplitude along a specific angle Φ. Two fibre families are visible in (b) as two white elongated clouds oriented between the major axes. Note the 90° shift of the axes from (a) to (b) owing to the Fourier transformation. All angles in (c) are shifted back by 90° to correlate with the angles of the collagen fibres in the real image.

