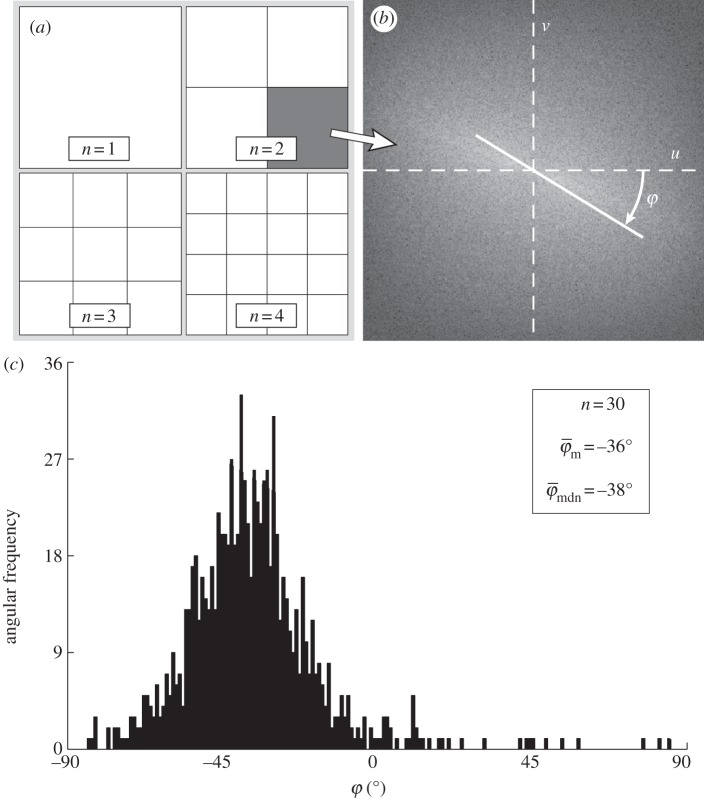
Figure 5.
Schematic of the steps to determine collagen fibre distributions at decreasing length scales (increasing dividing steps n). The original image ((a), n = 1) is continuously divided into an increasing number of regions of interest (ROIs), yielding n2 ROIs at each step n, as illustrated for n = 1−4 in (a). For every ROI, the Fourier power spectrum is calculated, from which the overall fibre angle φ of this ROI is determined by fitting a line through the centre of the power spectrum in a least-squares sense, as shown in (b). (c) A representative histogram of all angles for n = 30, yielding the angular distribution (900 angles) of the original image from figure 2b at this length scale (0° corresponds to the horizontal direction of the image). Normalizing the histogram by yields the computed probability mass function (PMF)
  . To describe the average behaviour of this distribution, the mean angle
  and the median angle
  are determined.

