
Figure 7.
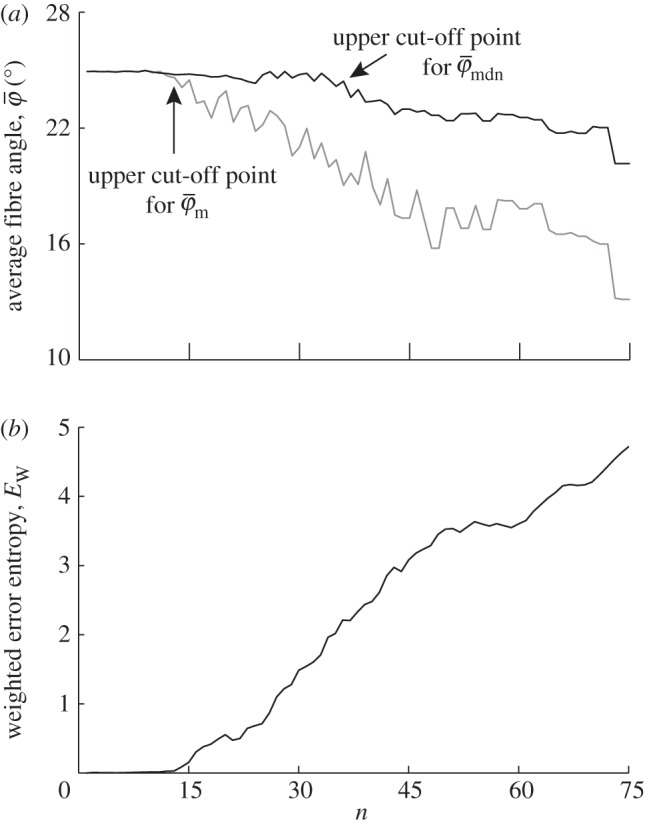
Results for the first test image (Figure 1a): (a) shows the mean angle  and the median angle
  for increasing dividing steps n, and (b) shows the weighted error entropy, Ew. Both measures
  and
and  in (a) yield the correct angle of 25° until around n = 12, confirming the capability of this method for extracting accurate angular data across different length scales. The mean angle
  starts to loose accuracy around n = 13 (upper cut-off point for
  ), whereas the median angle is more stable
  up to n = 36 (upper cut-off point for
  ). The weighted error entropy in (b) is relatively stable until around n = 13, corresponding to minor changes only in the probability mass functions (PMFs) across these length scales.