
Figure 8.
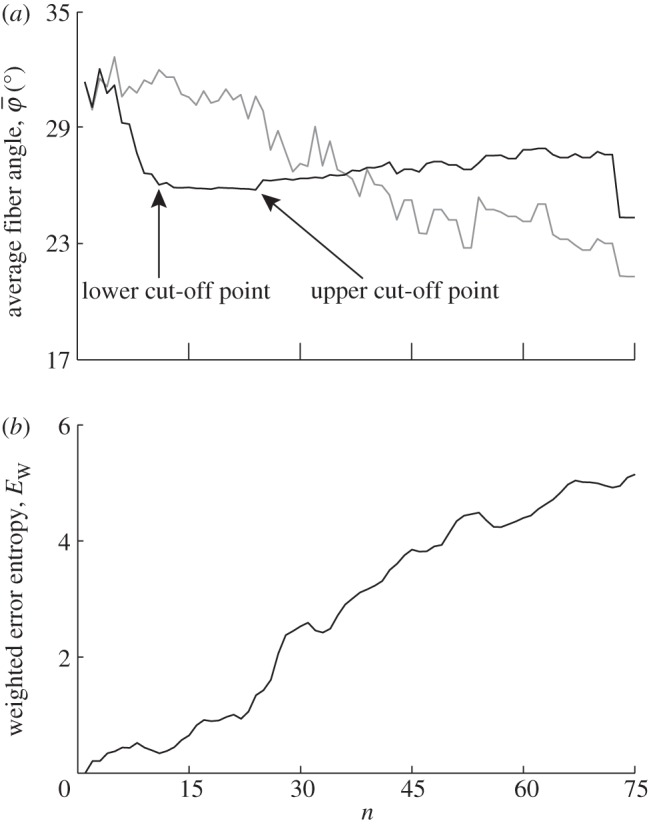
Results for the second test image that includes dispersion (figure 1b): (a) shows the mean angle  (grey line) and the median angle
  (solid line) for increasing dividing steps n, and (b) shows the weighted error entropy, Ew. In (a), the mean angle
  fluctuates and does not stabilize owing to the dispersion, and is, therefore, not suited for identifying a range of appropriate ROI sizes. On the other hand, the median angle
  initially fluctuates but stabilizes around n = 11, yielding a lower cut-off point (left arrow);
  is then stable up to n = 24 (upper cut-off point) before it starts to drift away. In the stable range of
  from n = 11 to n = 24, the n2 angles from all ROIs yield an angular distribution representing the orientation of lines in the input image. The weighted error entropy, Ew in (b) shows that after an initial increase the PMFs do not change much until n = 14.