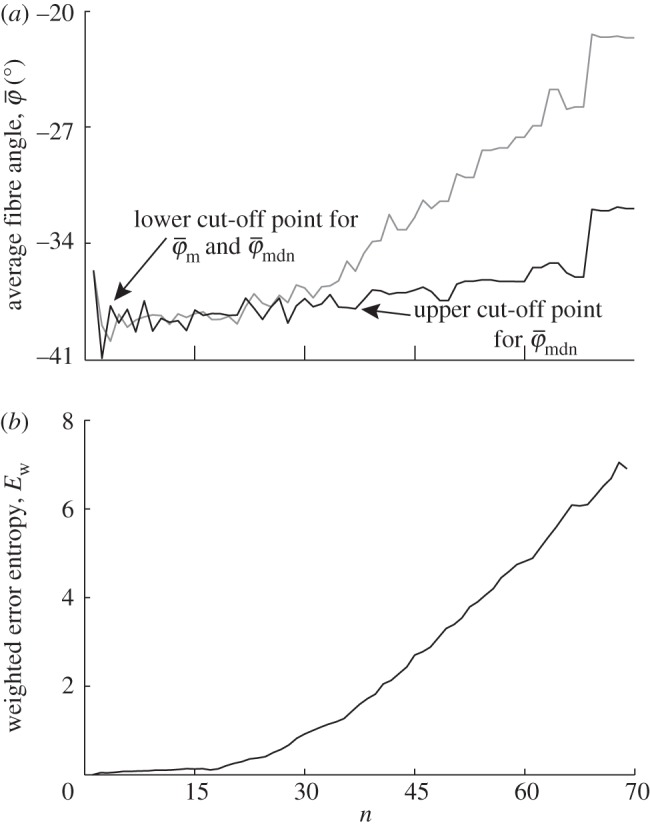
Figure 9.

Results for the second harmonic generation image of collagen fibres in the human media (figure 2b): (a) shows the mean angle  and the median angle
  for increasing dividing steps n, and (b) shows the weighted error entropy, Ew. In (a) we observe a lower cut-off point for both angles
  and
and  at n = 3. While
  starts to drift away after n = 19, the median angle
  displays a (relatively) stable behaviour over a wider n-range until about n = 40, followed by a small angular drift at decreasing ROI sizes. The weighted error entropy
  ) in (b) displays small changes of the probability mass functions (PMFs) up to n = 18. The entropy increase beyond that point coincides to the length scale where the stable region for
  in (a) starts to break down.
