
Figure 1.
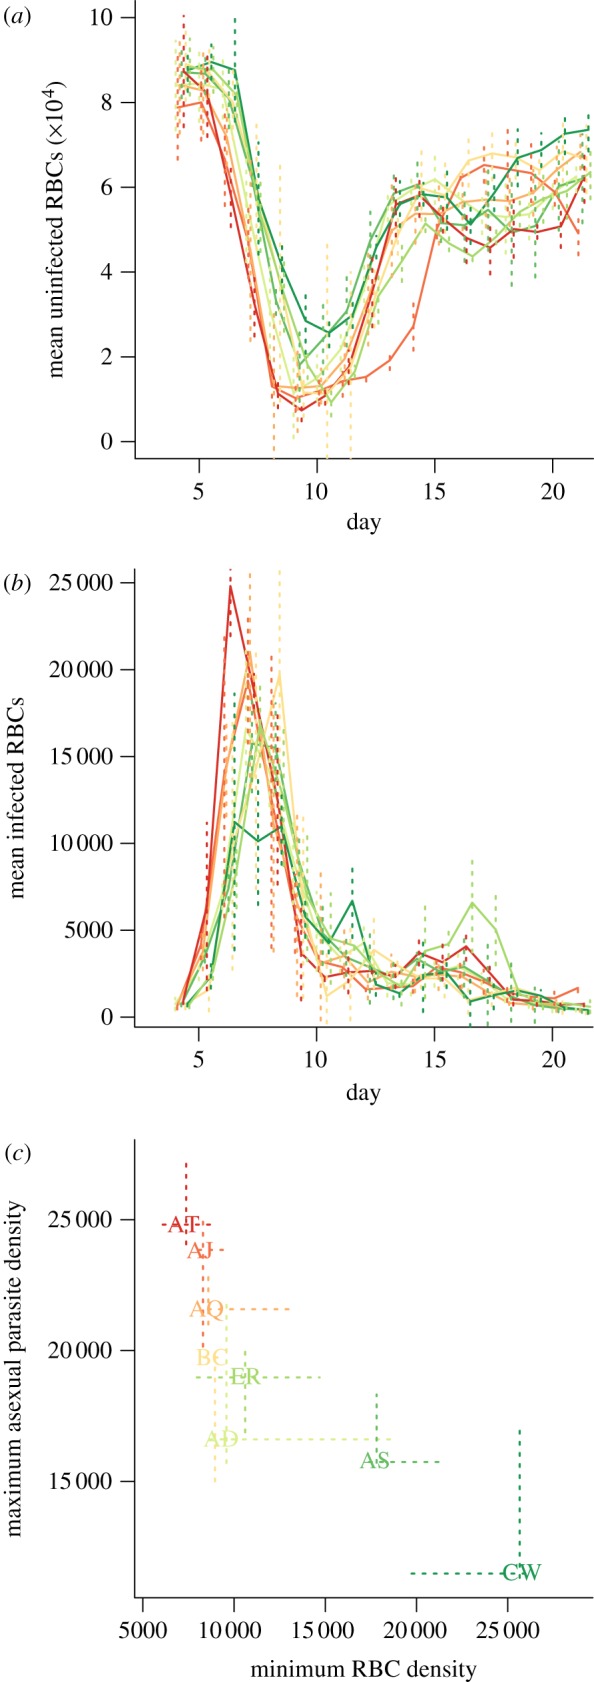
Time series of (a) mean uninfected and (b) infected RBCs per clone (×10−2 μl–1); vertical lines show standard deviations across five mice; and (c) relationship between maximum parasitaemia and depth of the RBC trough (×10−2 μl–1), suggesting the virulence–transmission trade-off, with dashed lines to indicate quartiles across individuals. Clone colours on the last panel correspond to those on the first two, and range from red for the clone resulting in the deepest RBC trough (AT), through to deep green for the clone resulting in the shallowest RBC trough (CW).