
Figure 3.
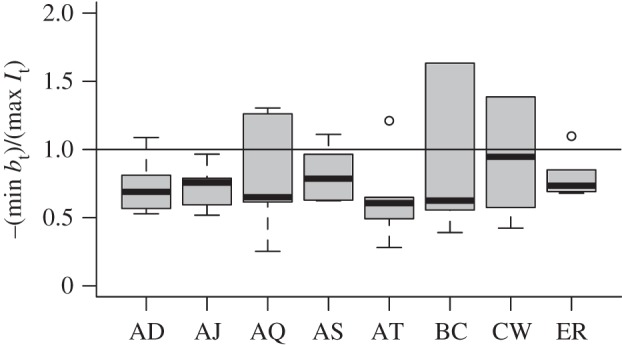
The ratio between minimum bt and maximum It for mice within the eight clones. Values greater than 1 (horizontal line) indicate that more cells were killed by immunity or retention in the spleen in one time-step than by the parasite in one time-step, comparing the maximum of each for each mouse. The degree to which this occurs varies across clones.