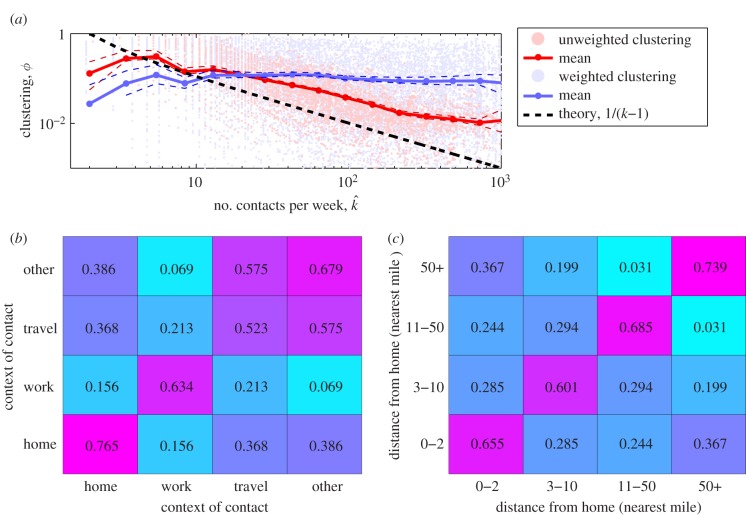
Figure 2.
Local clustering of contacts. (a) Relationship between number of contacts reported,  , and the clustering between those contacts (red, unweighted; blue, weighted); confidence intervals are determined by bootstrapping. (b,c) Transitive matrices showing the degree of clustering stratified by social context and distance from home; the values are the proportion of transitive links between contacts in different setting compared with the theoretical maximum.

