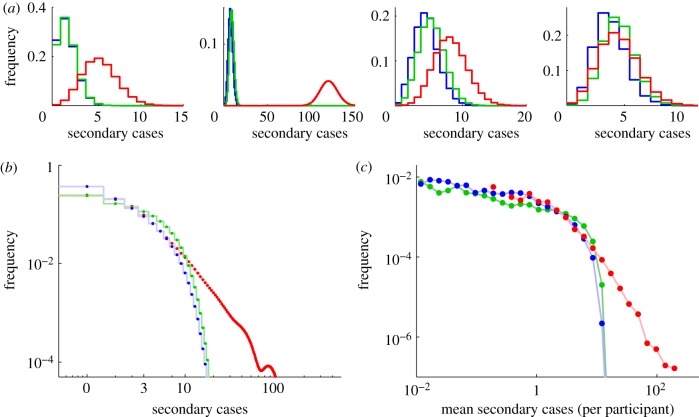
Figure 3.
Epidemiological implications of local network structure: three network models are compared: a simple (unweighted, unclustered) network (shown in red), a weighted network accounting for duration of contact (green) and a clustered weighted static network accounting for the full structure around participant (blue). (a) Distributions of the number of secondary cases (Ri) for the four examples in figure 1a. (b) Distribution of secondary cases across the entire sample of participants (Ri). (c) Distribution of expected number of secondary cases per participant ( ). We have modelled a short-lived, rapidly transmitted infection, with a latent period of 3 days, an infectious period of 3 days (
 ), and a transmission rate, τ, of 0.1 h− 1 across a network connection.

