
Figure 5.
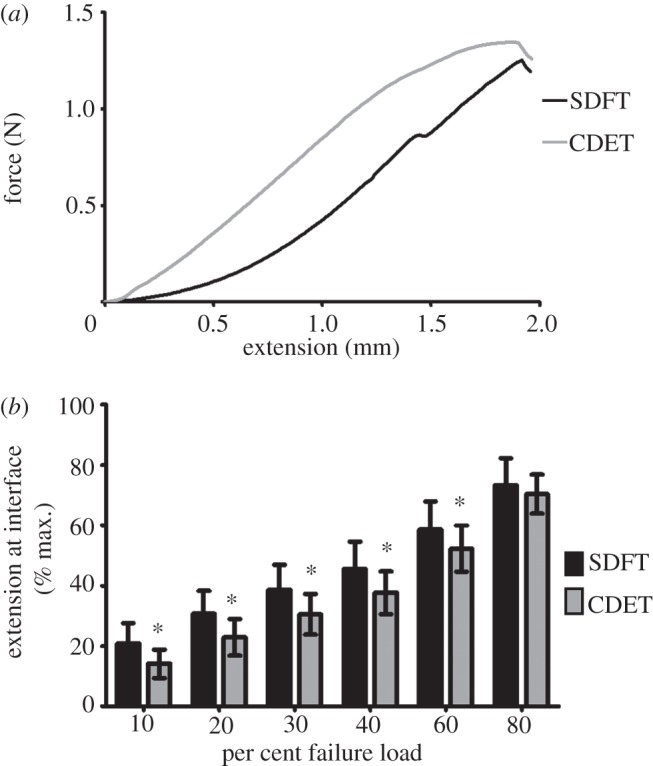
(a) A representative force–extension curve for the fascicular interface in the SDFT and CDET; (b) amount of extension at the fascicular interface at different percentages of failure load. Asterisk indicates significant difference between tendon types (p< 0.0001).