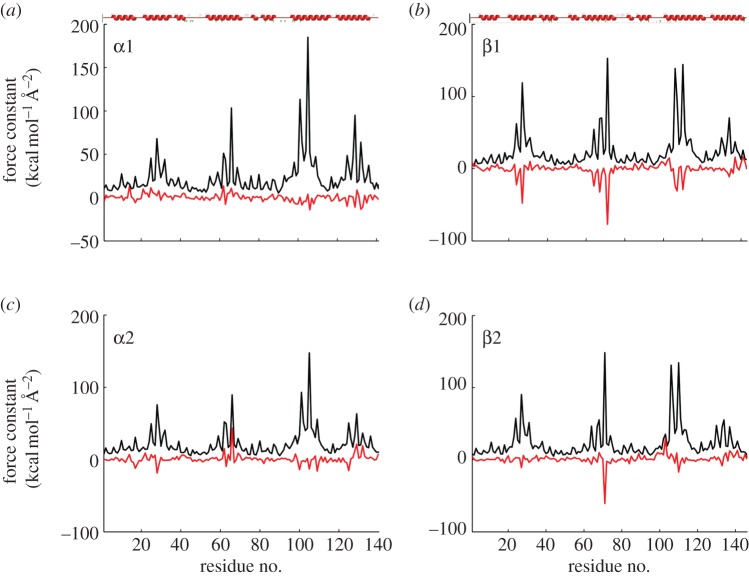
Figure 7.
(a–d) Force-constant profiles for the four monomeric units of chicken Hb (black lines) and force-constant variations Δk = khuman Hb − kchicken Hb for the monomers (red lines). The red secondary structures plot at the top of (a,b) indicate the localization of α-helices along the sequences of the α- and β-units (1 kcal mol−1 Å−2 = 0.7 N m−1).

