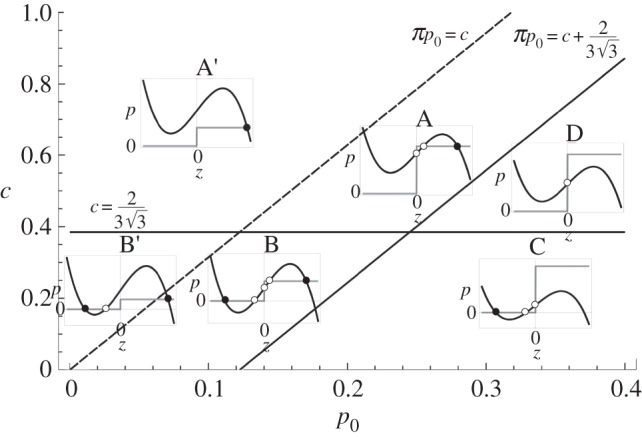
Figure 7.

A phase diagram of the dynamical model as a function of the two controlling parameters (p0, c). The lines separate the different behaviours that the trap can exhibit. The insets represent the nullclines in the (z, p) plane, where the black discs mark a stable stationary point, whereas the white discs represent unstable points. See the main text for the description of each region.
