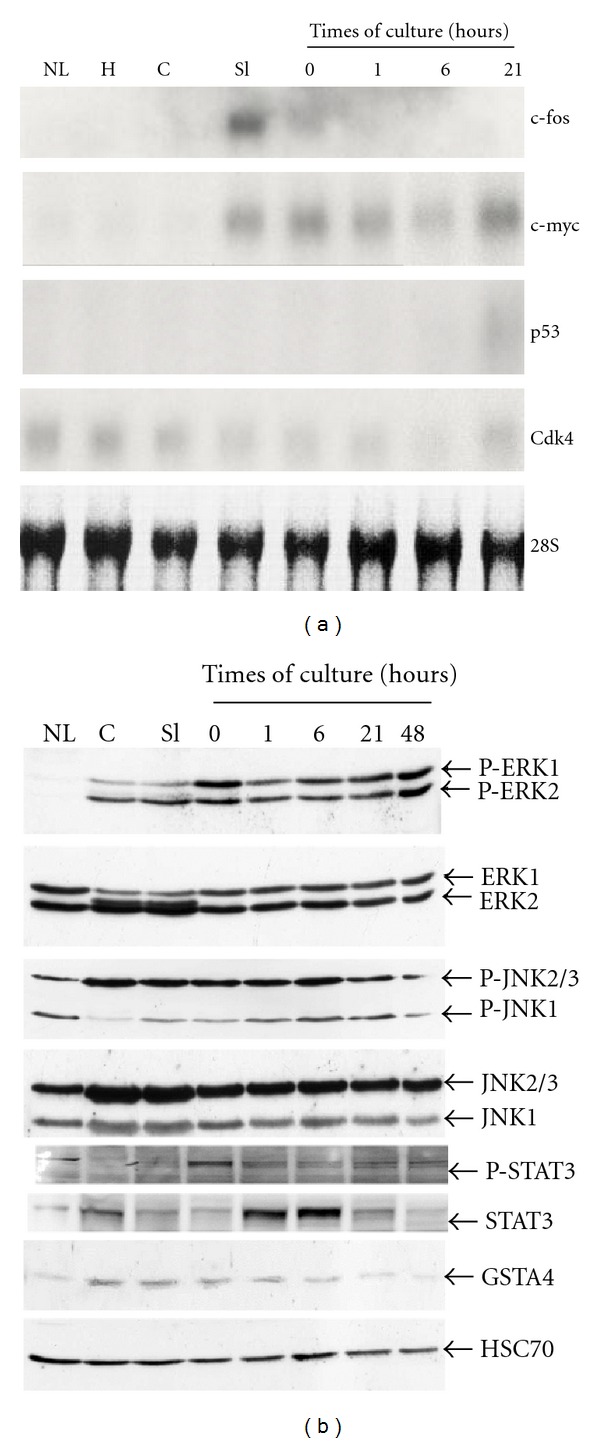
Figure 5.

Sequential activation of cell cycle markers and signalling pathways.(a) Northern blot analysis of c-fos, c-myc, and p53 mRNAs. Samples were: livers collected after perfusion by Krebbs buffer (L) and Viaspan solution (H), core (C), freshly cut slices (Sl), after preincubation (0), and at 1, 6, and 21 h of culture. Cdk4, known to be expressed in normal liver and throughout the cell cycle, and 28S ribosomal RNA were used to control equal loading of RNAs in each lane. (b) Western blot analysis of phospho- and total-ERK1/2, STAT3, and -JNK1/2/3. GSTA4, a marker of oxidative stress, was also studied while HSC70 was used as loading control. These data were found similar in 2 independent experiments.
