
Figure 1.
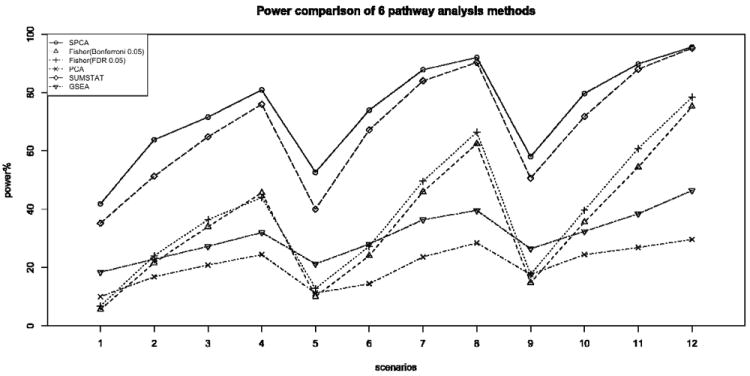
Comparison of power for six gene set analysis methods at 0.05 significance level, for 500-500 case-control samples with disease prevalence 0.05. The number of disease causal SNPs were chosen to be 5, 8, 10 and the variances of the normal distributions for coefficients beta of causal SNPs were 0.15, 0.2, 0.25 and 0.3. SPCA is the proposed Supervised PCA model; Fisher Bonferroni 0.05 and Fisher FDR 0.05 are Fisher’s exact test using Bonferroni 0.05 and FDR 0.05, respectively, as the threshold for declaring single SNP significance; PCA is the standard PCA regression; GSEA is the Gene Set Enrichment Analysis and SUMSTAT is sum statistic described in Hoh et al. (2001).