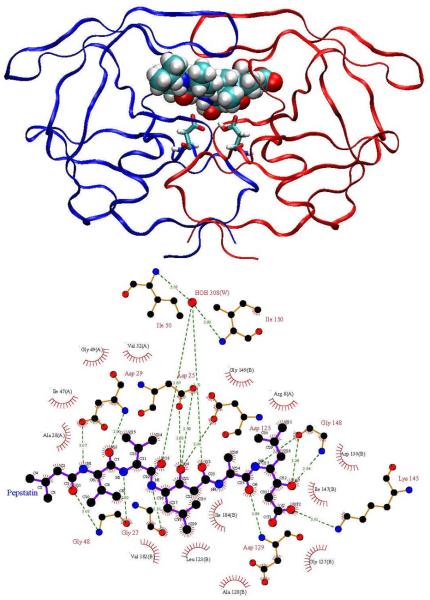
Figure 1.
HIV-1 protease in complex with pepstatin. Top: Ribbon representation of HIV-1 protease colored by chain, pepstatin shown in van der Waals spheres, and the catalytic aspartates shown in licorice. Bottom: LigPlot [78] representation of the HIV protease active site. Hydrogen bonds shown with green dotted lines and van der Waals contacts are shown by red hatched circles. The following two figures show the decoys used in this study, human pepsin and human cathepsin D.

