
Figure 3.
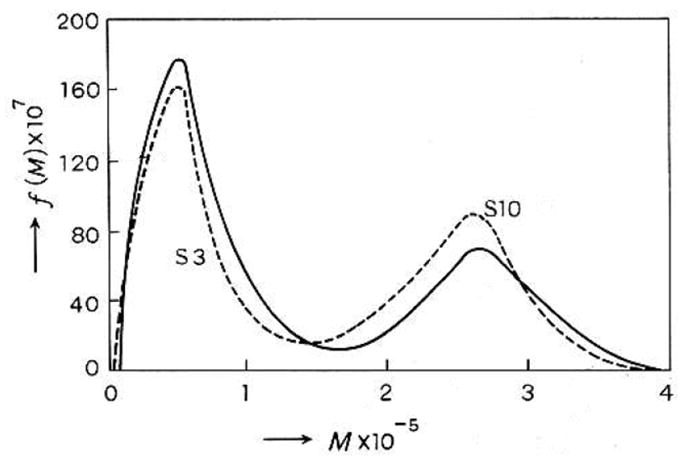
Fujita’s plot [1] of sedimentation coefficient distribution for a 50:50 mixture of two polystyrene samples S3 and S10 in cyclohexane obtained using Eqs. (7–12). The dashed line represents the predicted distribution for the mixture based on the individually obtained distributions for S3 and S10. [Permission being sort from Elsevier].